
Image caption
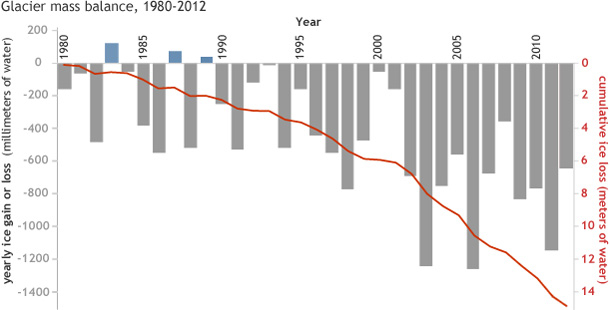
Annual gains (blue bars) and losses (gray bars) for 30 reference glaciers from 1980-2012. The red line shows cumulative ice loss. Cumulative losses through 2012 are close to 15 meters (50 feet) water equivalent. Graph adapted from Figure 2.10 in State of the Climate in 2013.