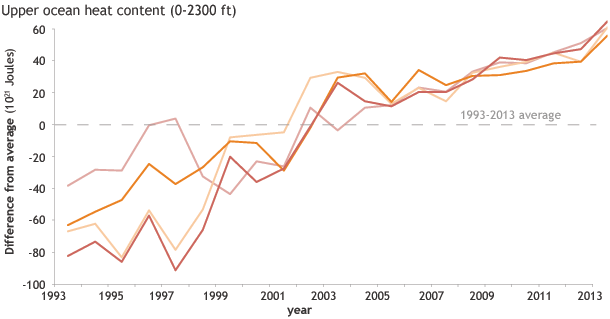
Image caption
Annual difference from average ocean heat content since 1993 from several data sources. Despite difference in exact values among data sources, the overall trend is similar: heat content in the global ocean has risen in the past two decades. Graph adapted from Figure 3.7 in State of the Climate in 2013.