
Image caption
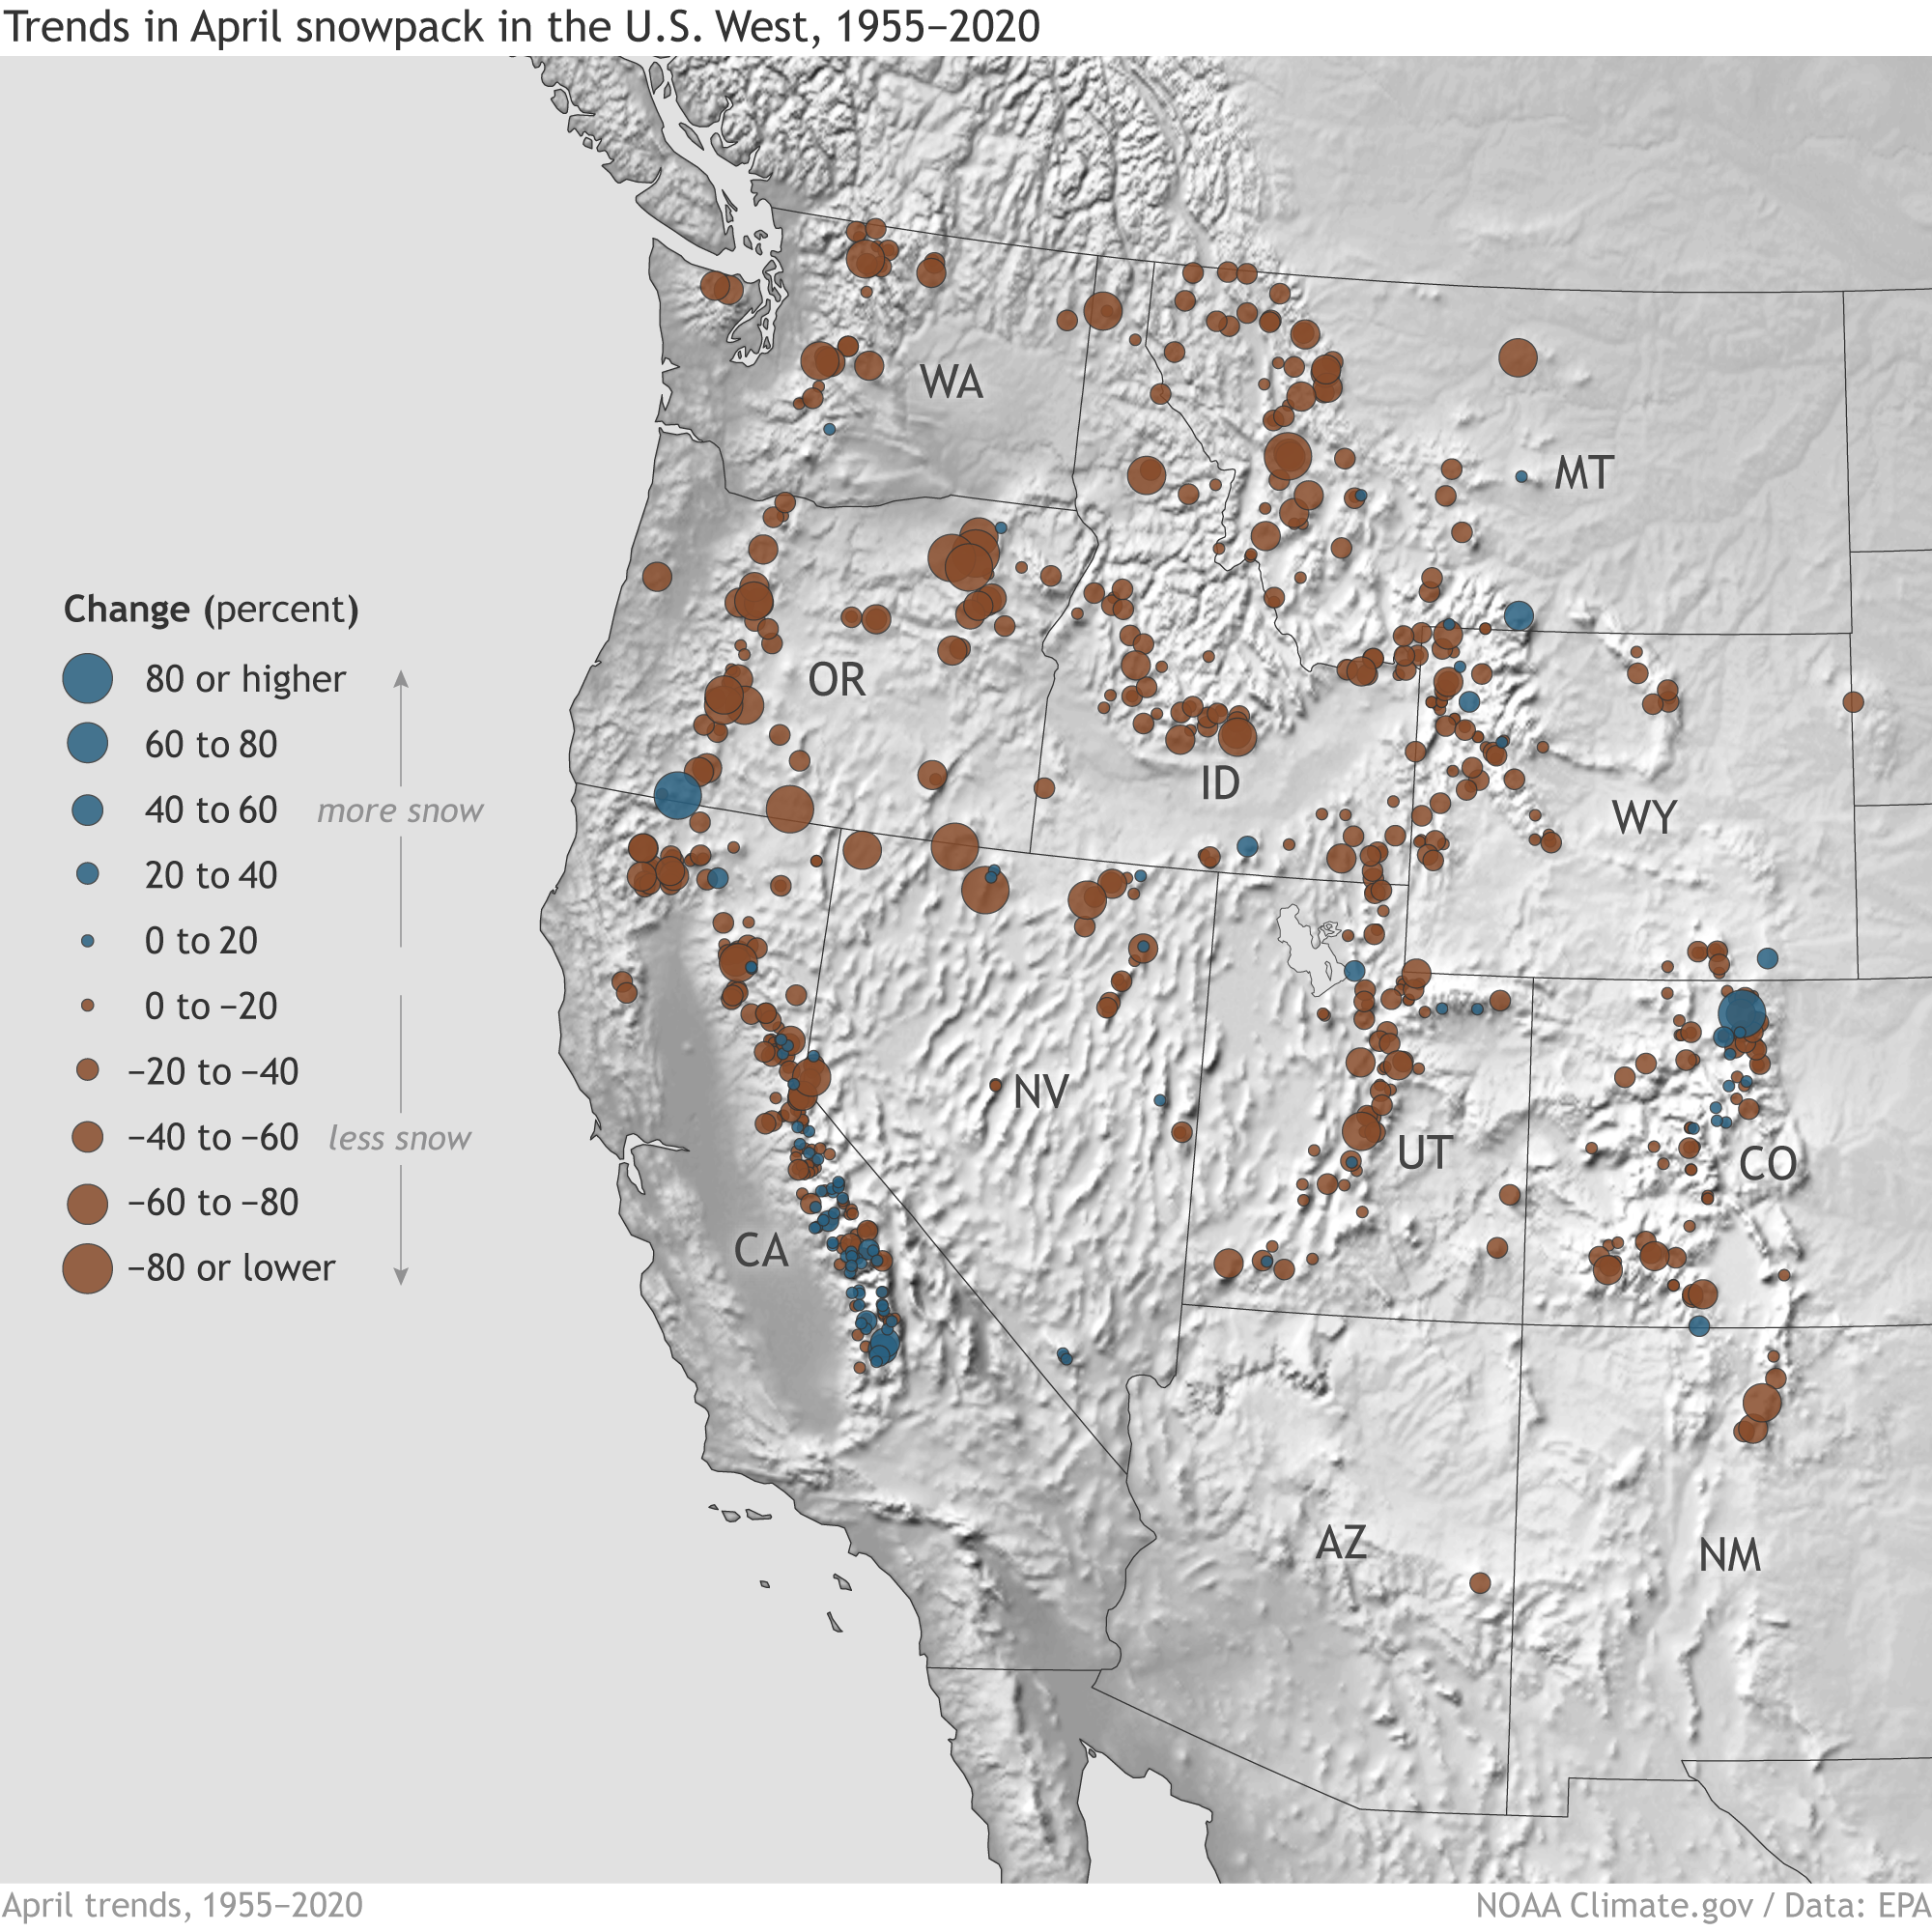
Observed change in April snowpack—historically the month of peak snow volume—across the western United States from 1955–2020. Locations where April snowpack has increased appear in blue, with larger dots for bigger increases. Locations where April snowpack has decreased appear in brown, with larger dots indicating bigger declines. Map by NOAA Climate.gov based on USDA Natural Resources Conservation Service snow data provided by the EPA.