
Image caption
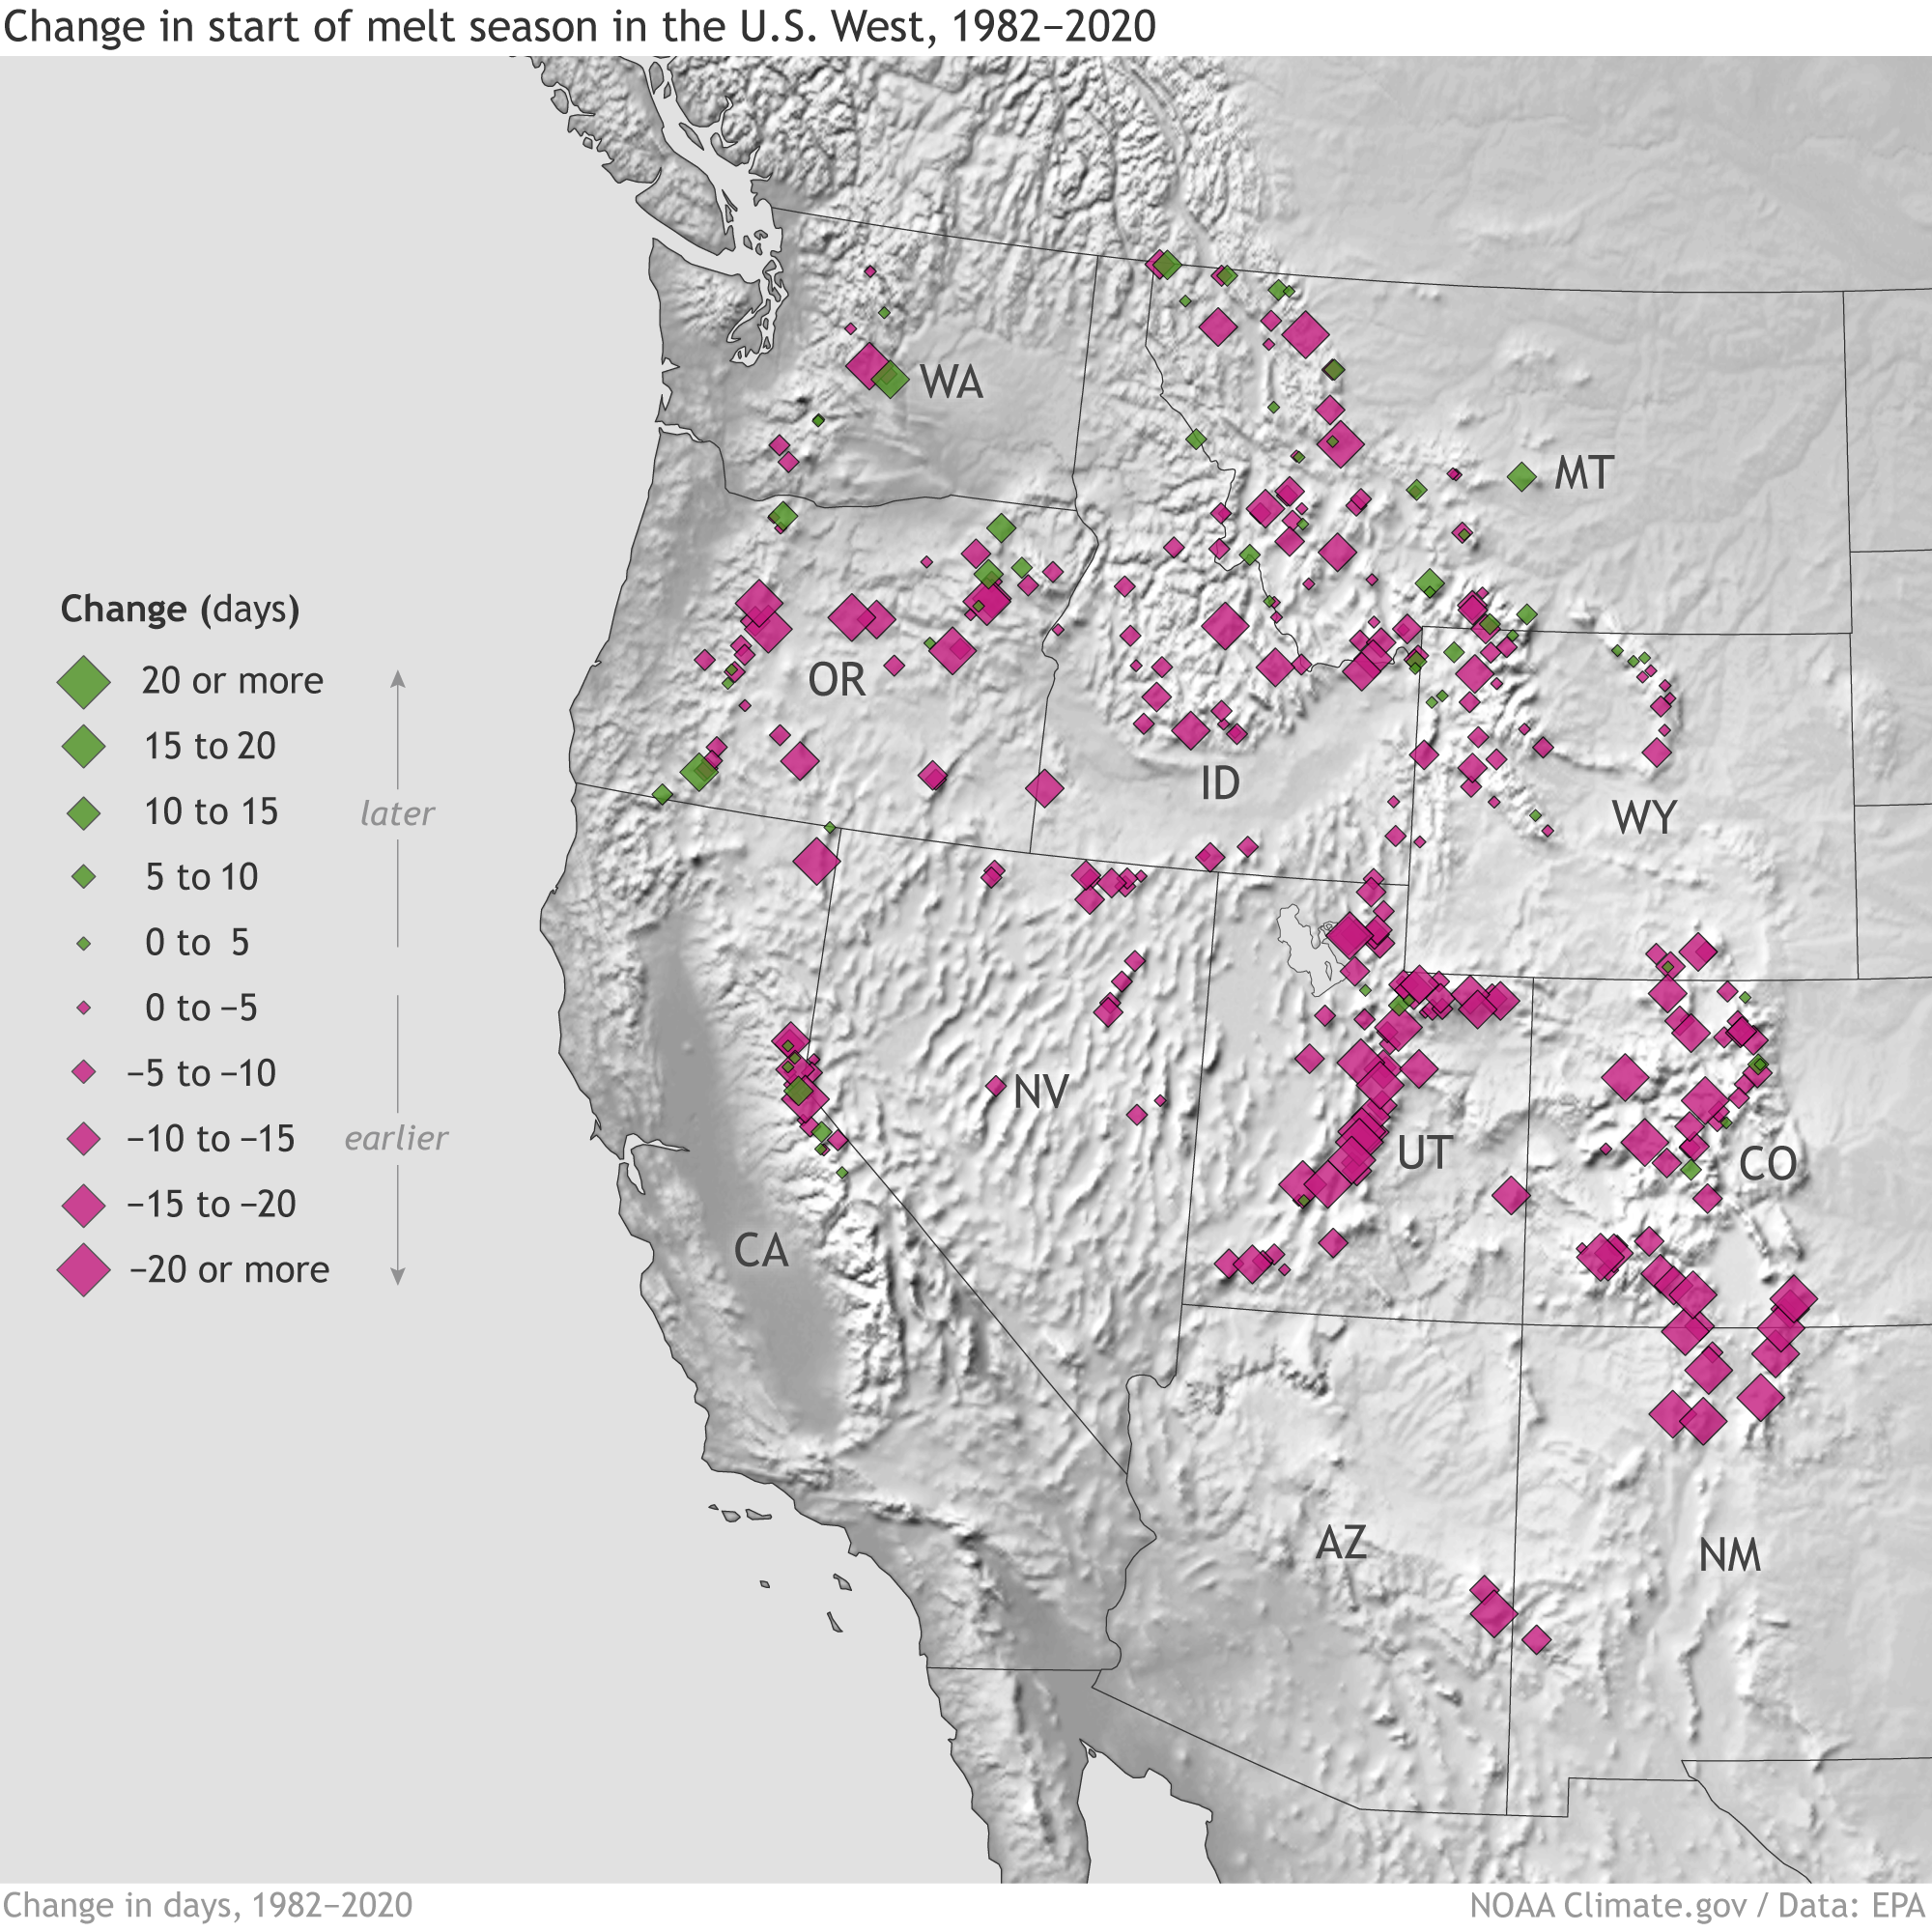
Observed changes in the timing of peak snowpack from 1982–2020. Locations where snowpack is peaking earlier in the year appear in pink, and locations where snowpack is peaking later in the year appear in green. Map by NOAA Climate.gov based on USDA Natural Resources Conservation Service snow data provided by the EPA.