
Image caption
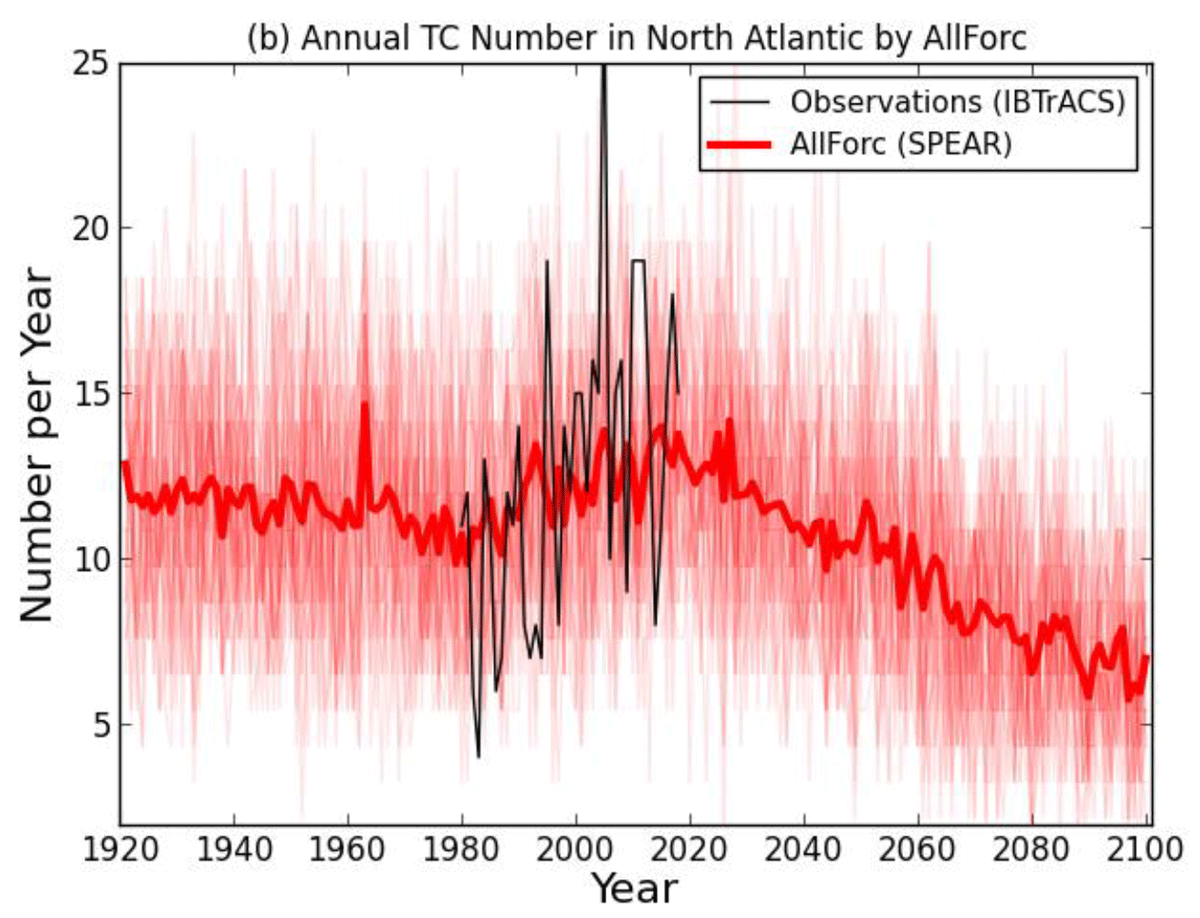
Comparison of observed (black) and modeled (red) Atlantic tropical cyclone frequency. The models, which included historical estimates of volcanic activity and human-produced greenhouse gases and aerosols, closely simulated the observed increase in activity from 1980-2020. Image from Murakami et al., 2020.