
Image caption
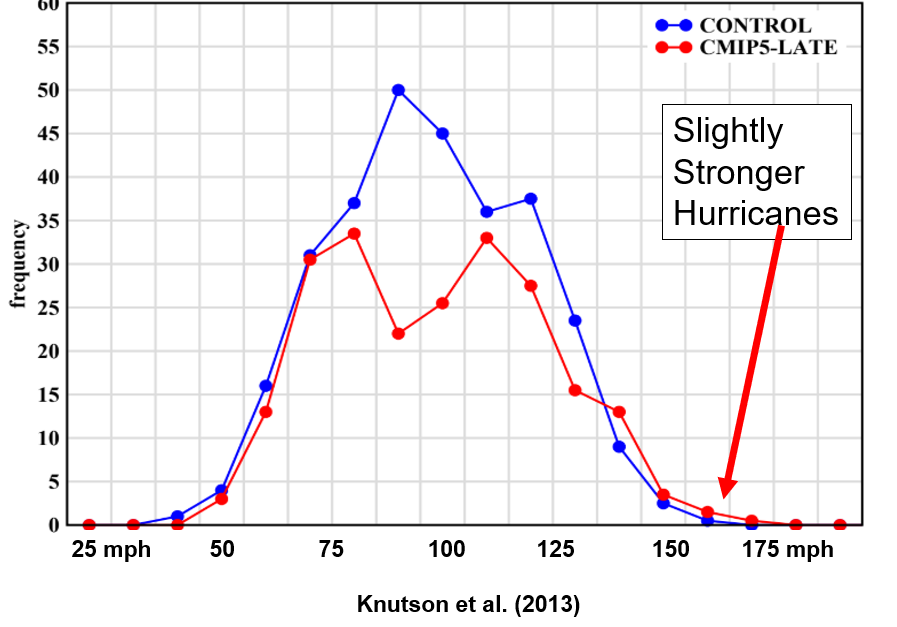
The frequency of maximum winds speeds of various strengths in today's climate (blue line) and a future climate (red line) with substantial increases in greenhouse gases. Figure courtesy Chris Landsea.
This website is an ARCHIVED version of NOAA Climate.gov as of June 25, 2025.
Content is not being updated or maintained, and some links may no longer work.
The frequency of maximum winds speeds of various strengths in today's climate (blue line) and a future climate (red line) with substantial increases in greenhouse gases. Figure courtesy Chris Landsea.