
Image caption
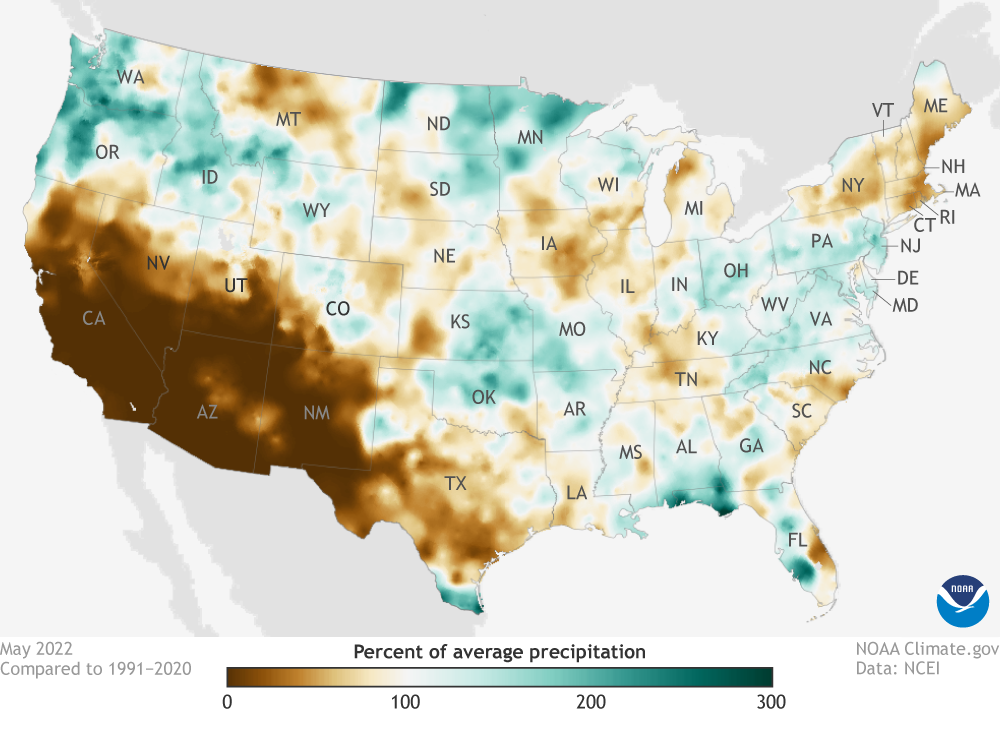
Percent of average (1981-2010) precipitation for May 2022. (View Alaska). Most of the country was a mix of regions that were drier than average (brown) or wetter than average. But a broad area of the Southwest from California to Texas received much less than its average May precipitation. NOAA Climate.gov map from Data Snapshots, based on climate division data from NCEI.