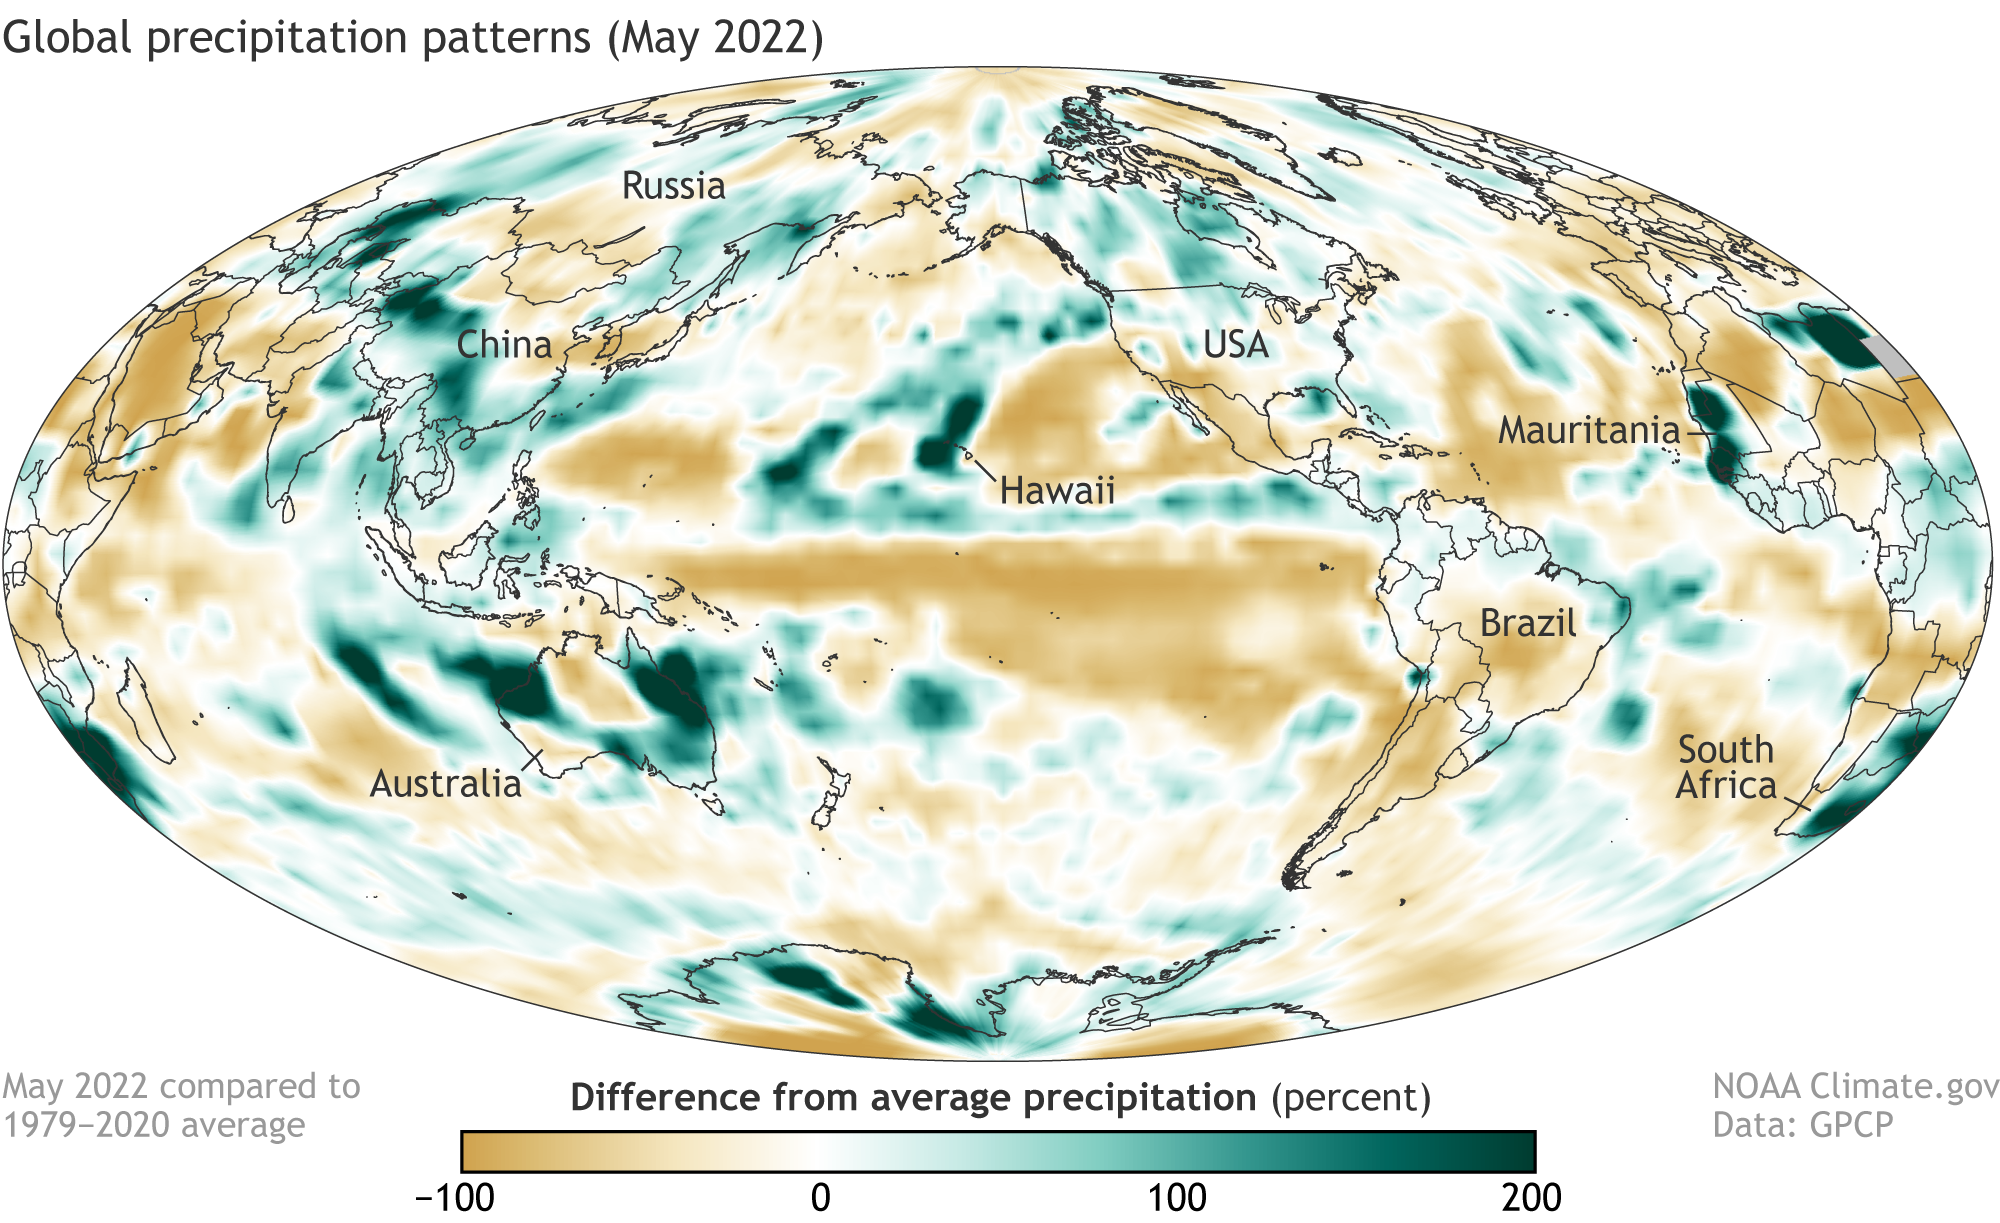
Image caption
Percent difference from average precipitation for May 2022. Places where precipitation was 200 percent or more above average are darkest green; places where precipitation was up to 100 percent below average (i.e. no rainfall) are brown. NOAA Climate.gov map, based on data from the Global Precipitation Climatology Project.