
Image caption
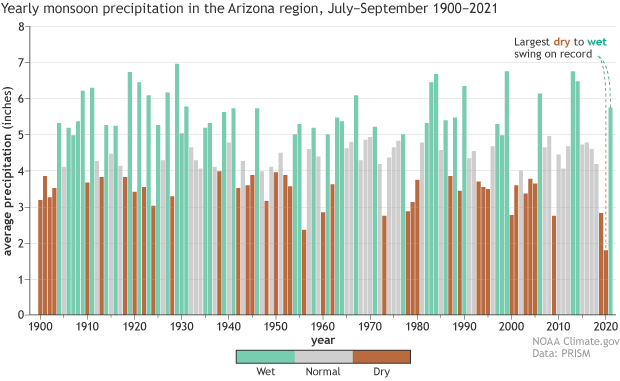
On the heels of the driest summer on record in 2020, the July–September period in 2021 was much wetter than average. The switch was the biggest one-year change on record from 1900–2021. NOAA Climate.gov graph, based on PRISM data from Oregon State University.