
Image caption
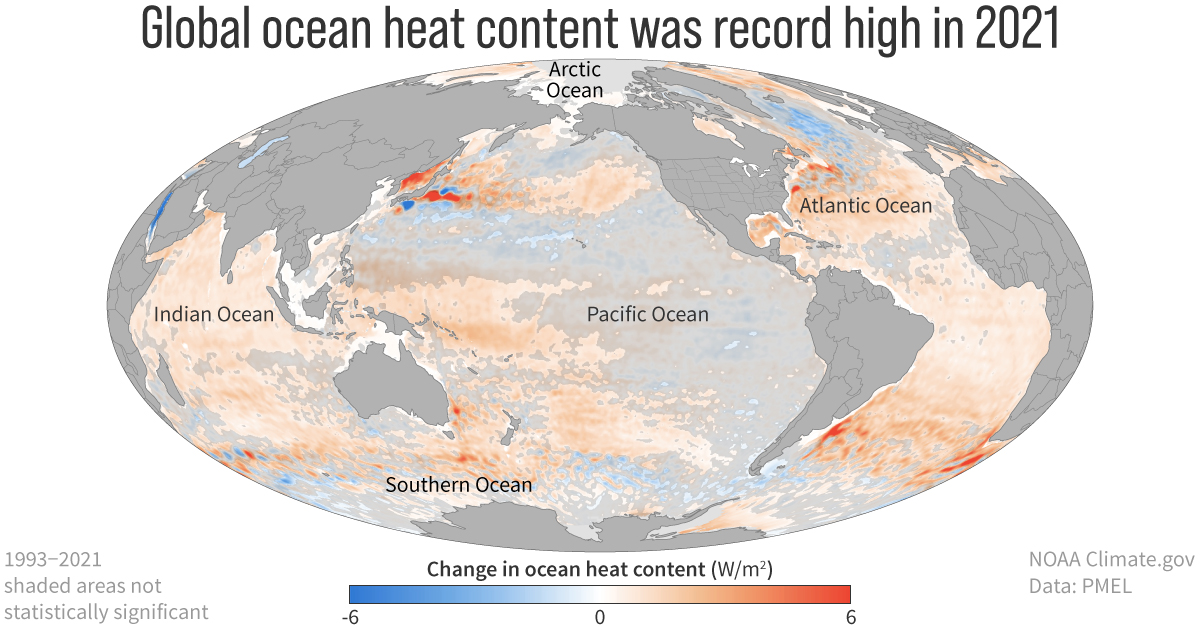
Most of the excess energy being trapped in the Earth system by increasing amounts of greenhouse gases is stored in the ocean. This map shows where the global ocean gained (orange) or lost (blue) energy between 1993 and 2021. Places where the trend is small relative to year-to-year variability (not statistically significant) are shaded with gray. NOAA Climate.gov map, based on data provided by John Lyman.