
Image caption
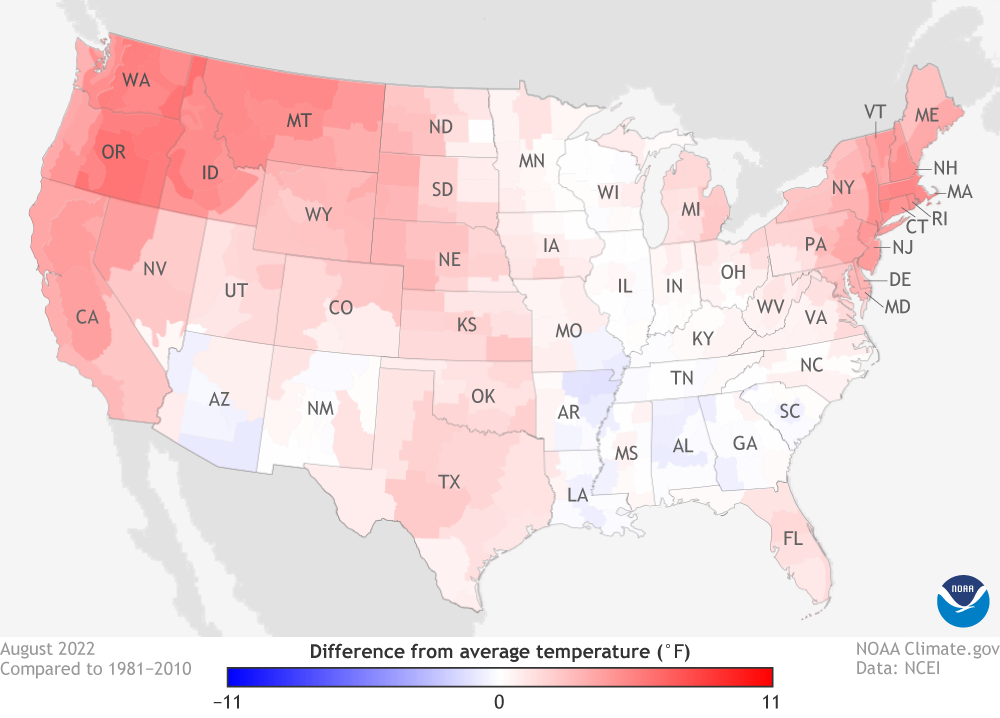
U.S. temperatures in August 2022 compared to the 1981-2020 average, with climate divisions that were hotter than average colored in shades of red and divisions that were cooler than average in shades of blue. (See Alaska.) Map from Climate.gov Data Snapshots, based on data from the National Centers for Environmental Information.