
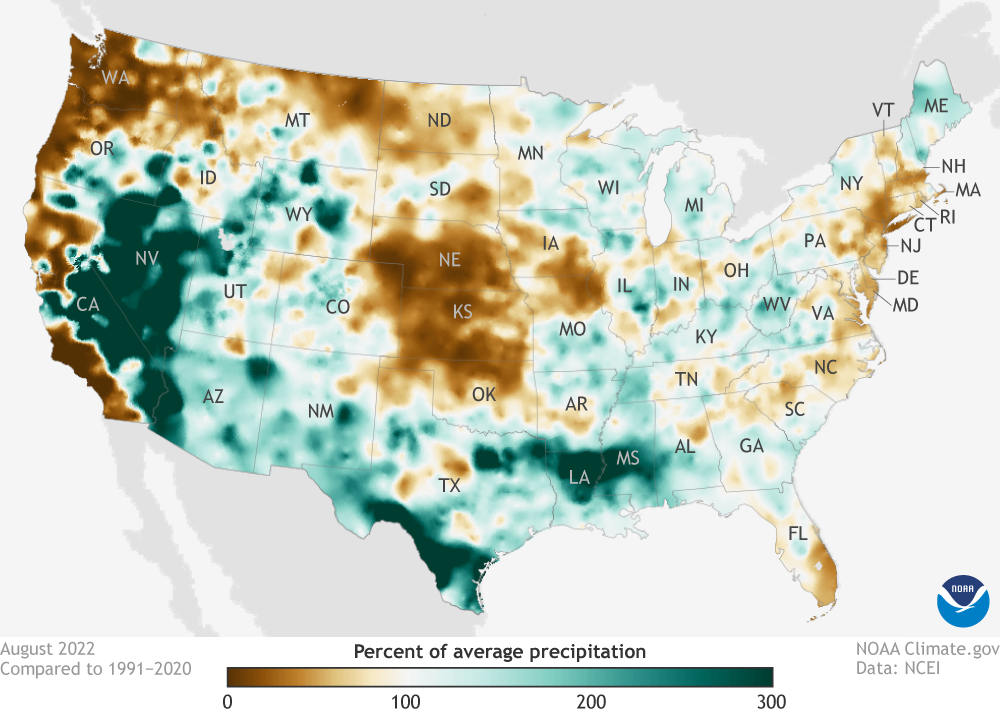
Image caption
Precipitation in August 2022 as a percent of the 1990-2020 average. Places where precipitation was less average are brown; places where precipitation was 300 percent or more above average are colored green. (See Alaska.) Map from NOAA Climate.gov Data Snapshots, based on data from the National Centers for Environmental Information.