
Image caption
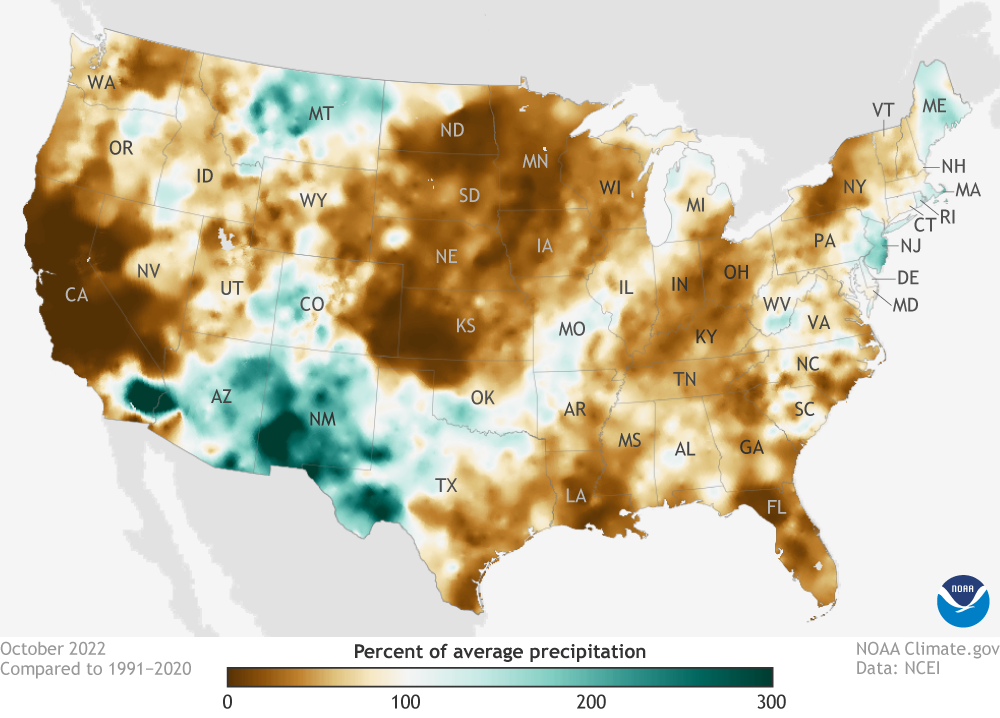
Precipitation in October 2022 compared to the 1991-2020 average, with places that were drier than average colored brown and places that were wetter than average colored blue-green). (View Alaska.) Climate.gov map from Data Snapshots, based on data from NOAA National Centers for Environmental Information.