
Image caption
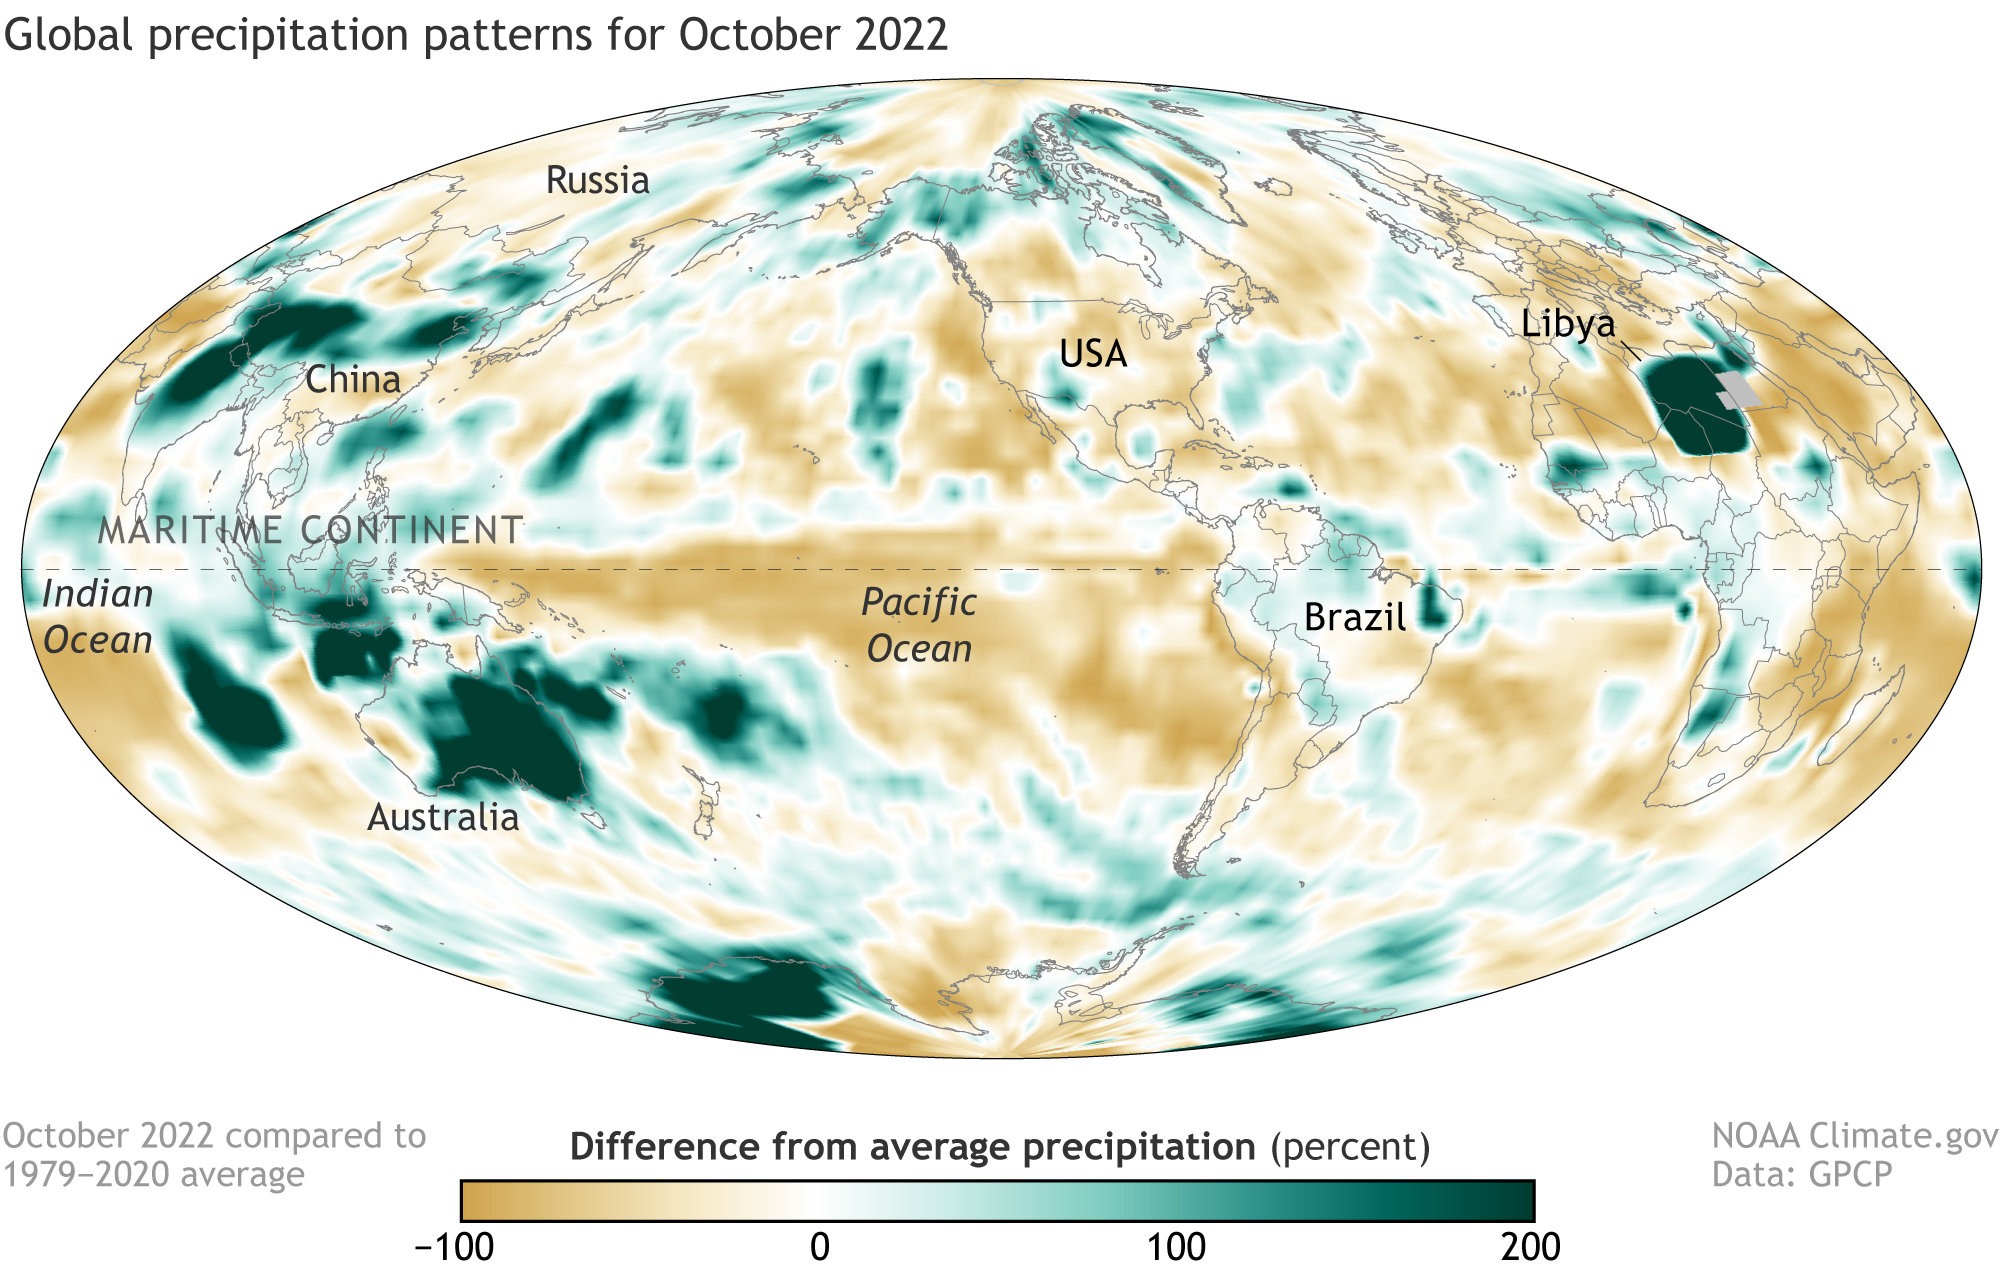
Percent difference from average precipitation across the world in October 2022. Places that were wetter than average are green; places that were drier than average are brown. The influence of La Niña is obvious across the tropical Pacific, with a broad band of drier-than-average conditions in the central/eastern part of the basin, and a strong wetter-than-average signal over the Maritime Continent. NOAA Climate.gov map based on data form the Global Precipitation Climatology Project.