
Image caption
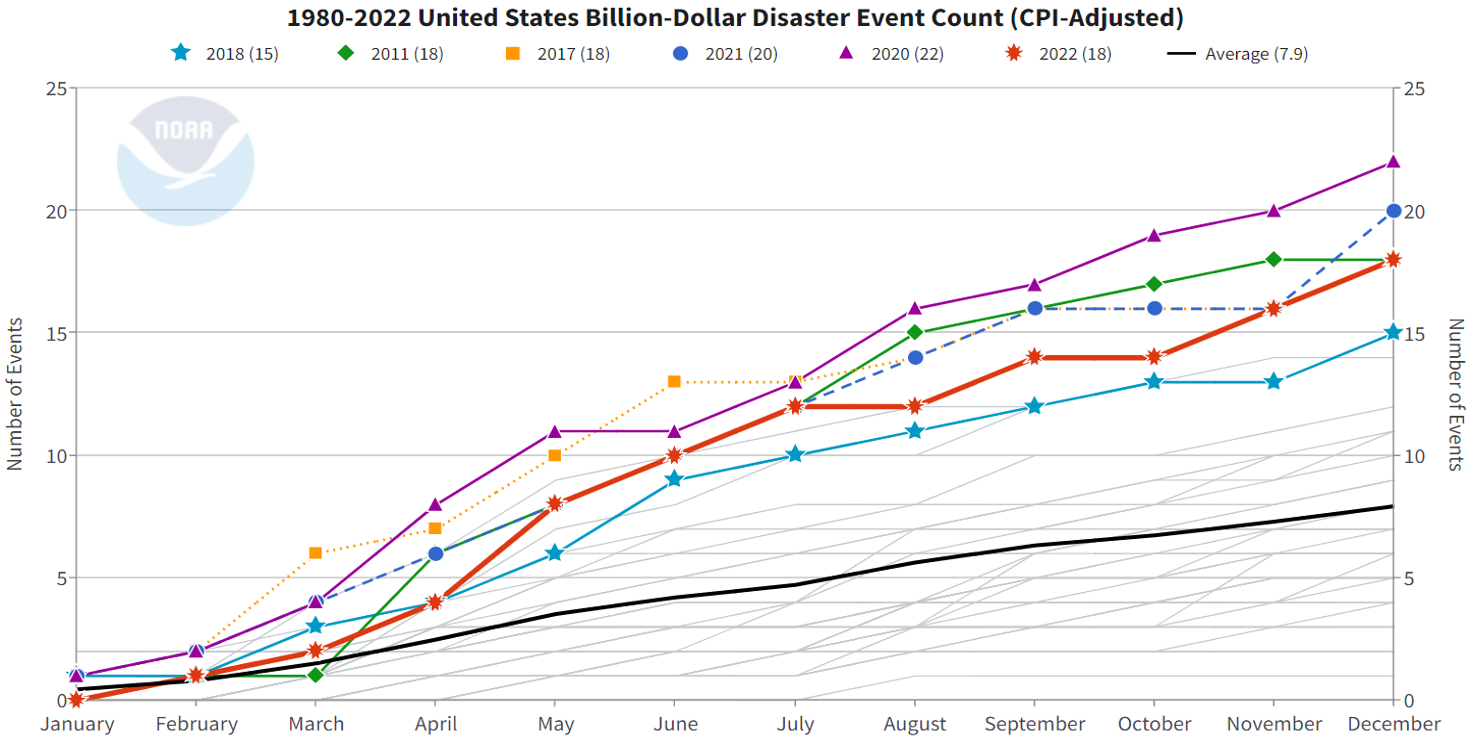
Month-by-month accumulation of billion-dollar disasters for each year on record. The colored lines represent the top 6 years for most billion-dollar disasters. All other years are colored light gray. NOAA image by NCEI.
Month-by-month accumulation of billion-dollar disasters for each year on record. The colored lines represent the top 6 years for most billion-dollar disasters. All other years are colored light gray. NOAA image by NCEI.