
Image caption
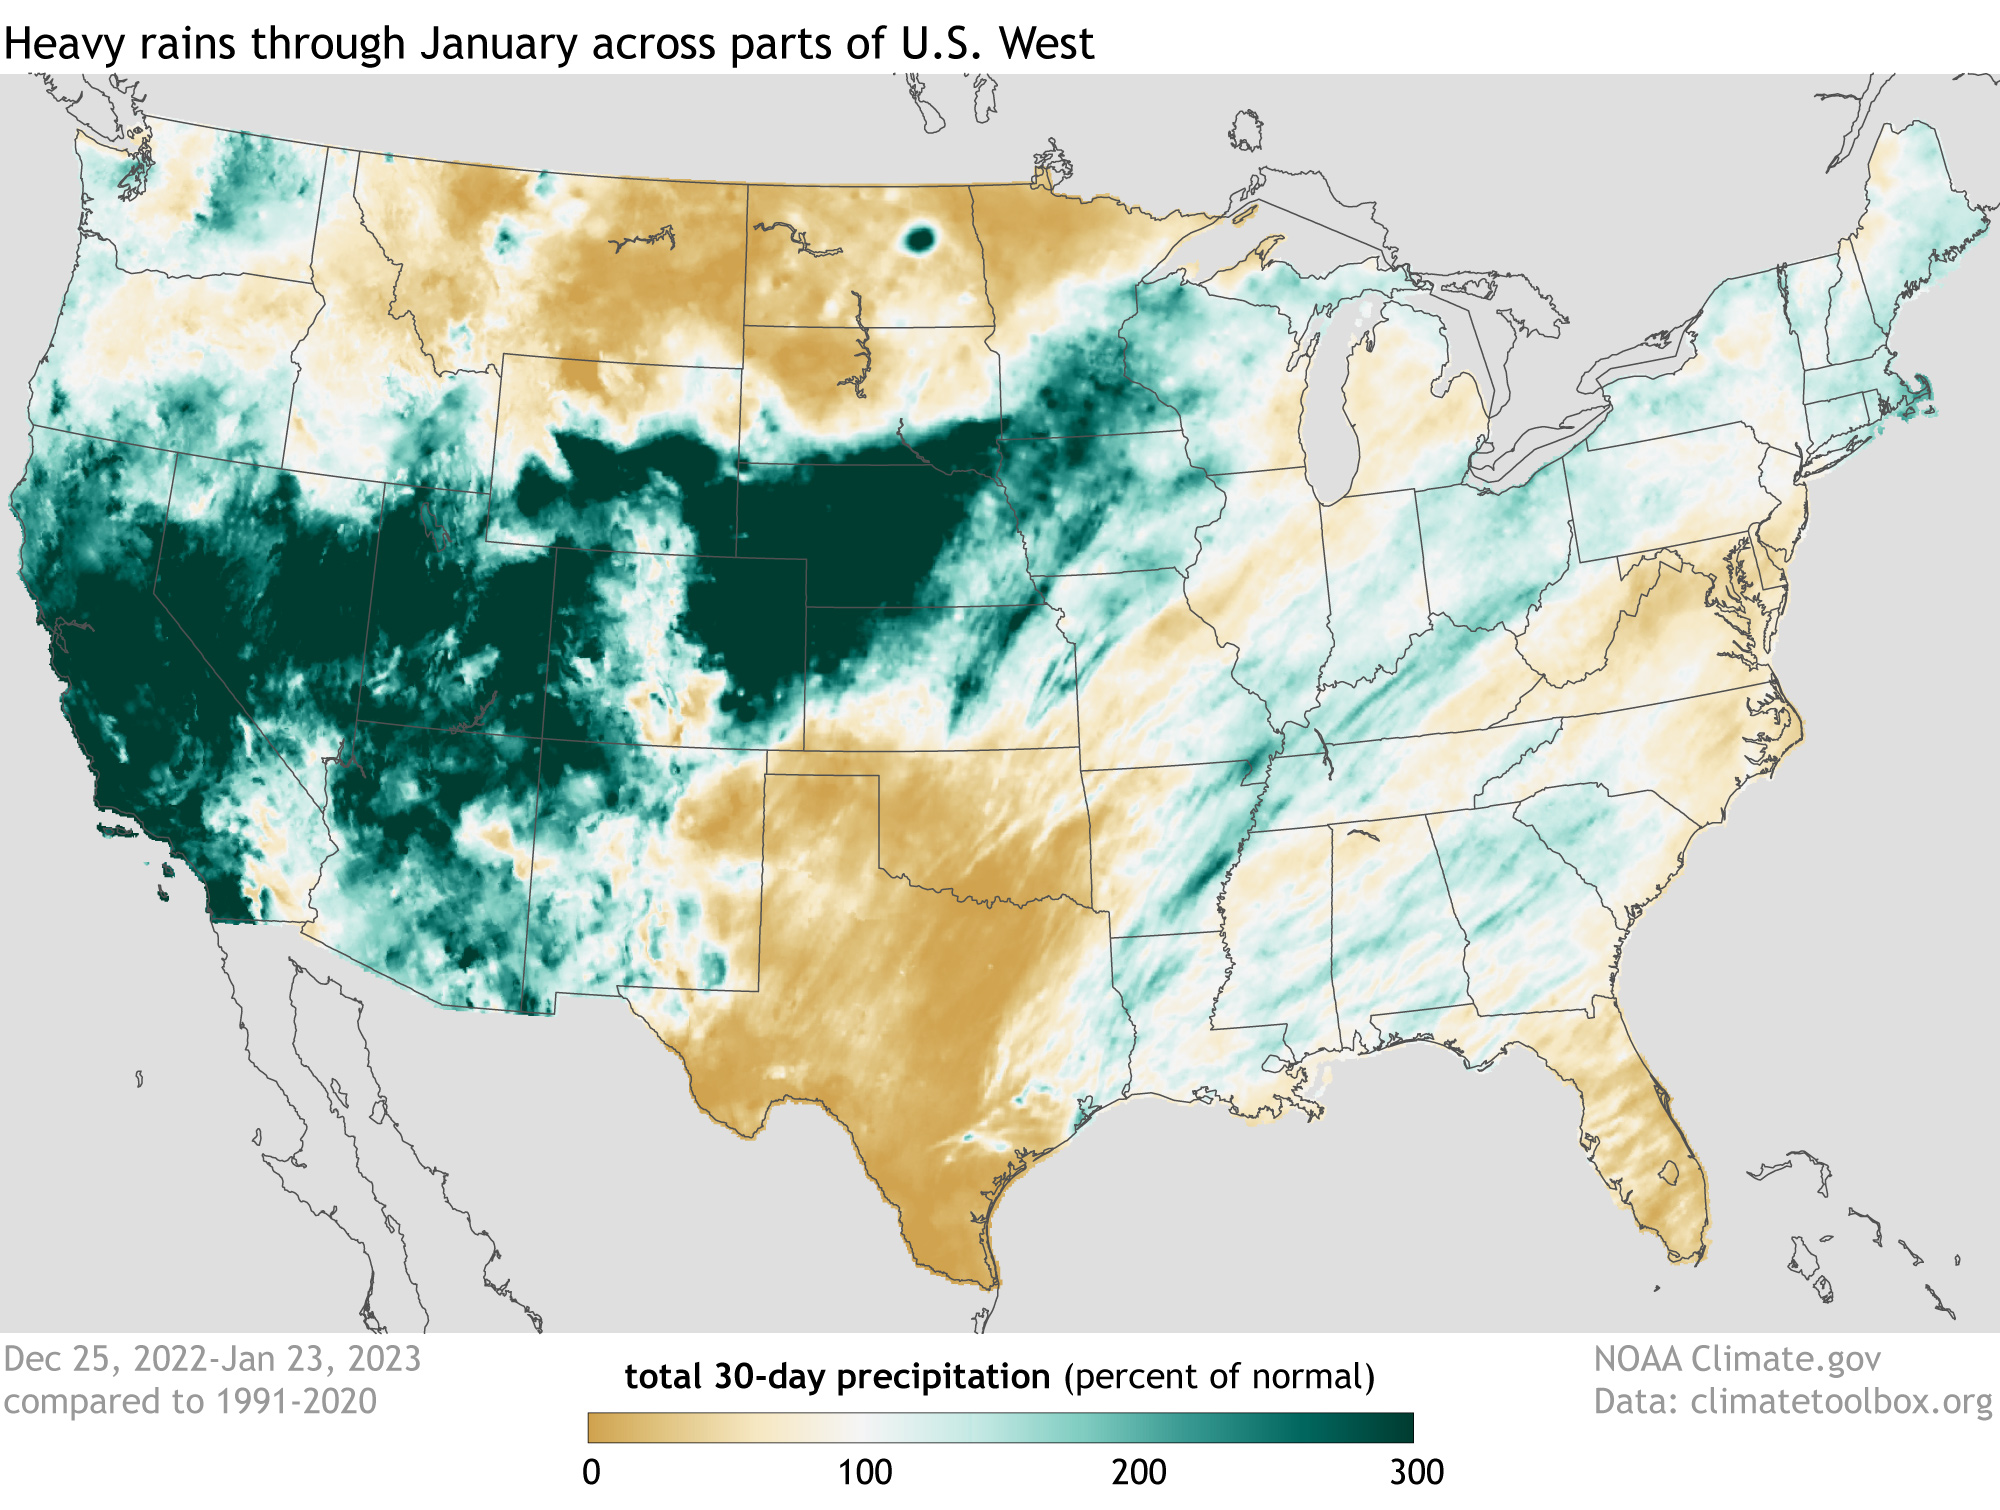
Percent of normal U.S. precipitation over the past 30 days (December 25, 2022, through January 23, 2023) after a series of weather events known as atmospheric rivers, fueled by tropical moisture, flooded the U.S. West with rain and snow. Places where precipitation was less than 100 percent of the 1991-2020 average are brown; places where precipitation was 300 percent or more than average are blue-green. NOAA Climate.gov image, based on analysis and data provided by the Climate Mapper website.