
Image caption
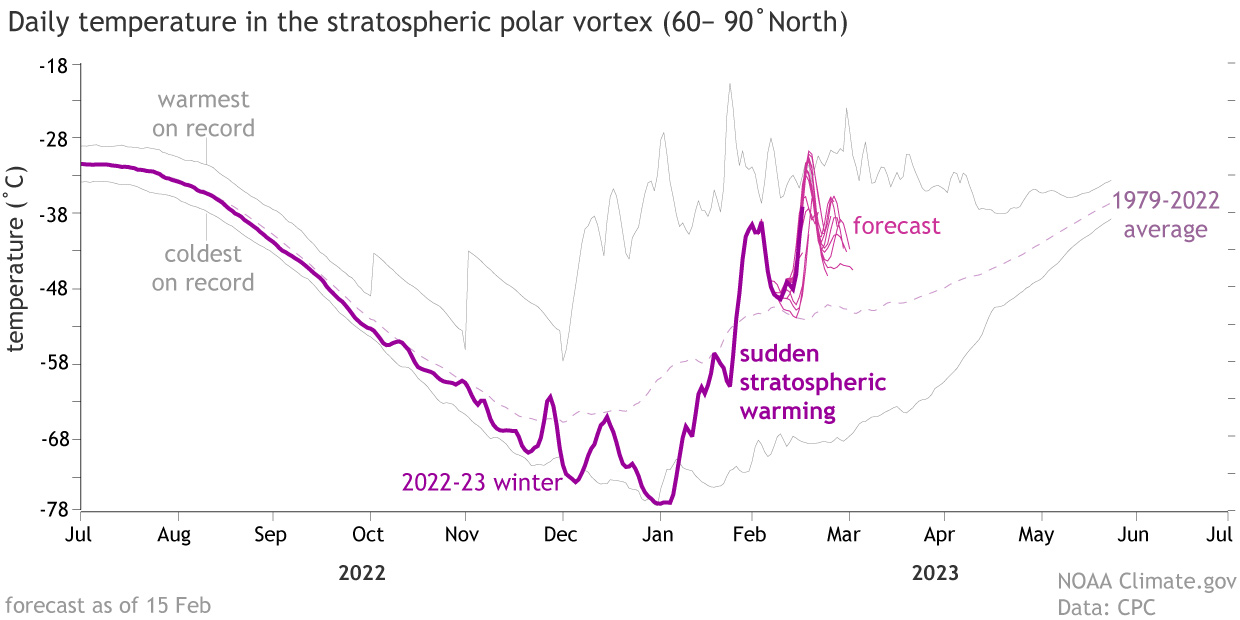
Average daily temperatures in the polar stratosphere (10-millibar pressure level) of the Northern Hemisphere from late 2022 into early 2023 (dark purple line). The faint gray lines show the warmest and coldest temperatures on record from 1979-2022, and the dashed purple line shows the average. In early January, temperatures hit a near-record low before rising rapidly in early February. Forecasts (pink lines show the predictions from multiple computer models) indicate that the warming will hit a new peak in coming days. NOAA Climate.gov image, based on data provided by Laura Ciasto, NOAA Climate Prediction Center.