
Image caption
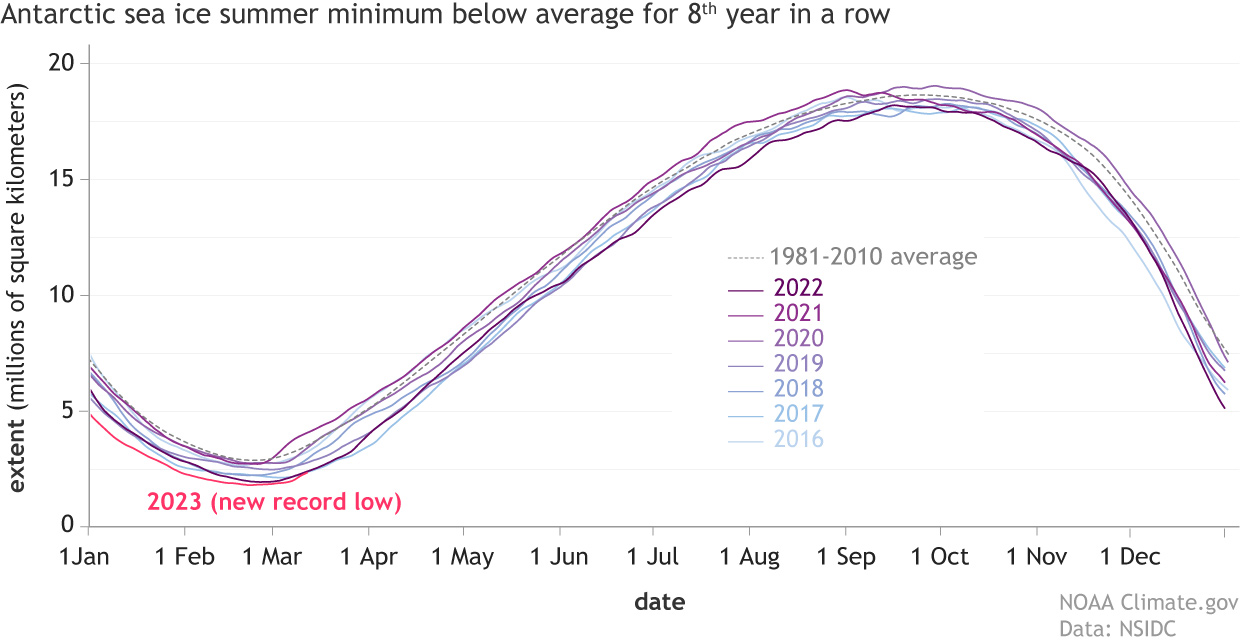
Each line shows daily sea ice extent—the total area at least 15% ice covered—in the Southern Ocean around Antarctica from 2016 (lightest blue) through 2023 (bright pink), which set a new record for smallest summer minimum. The summer minimums for the past eight years have all been below average (dotted line). This pattern is unusual, but still not statistically significant because of the wide range of historical variability. NOAA Climate.gov image, adapted from Charctic data from the National Snow and Ice Data Center.