
Image caption
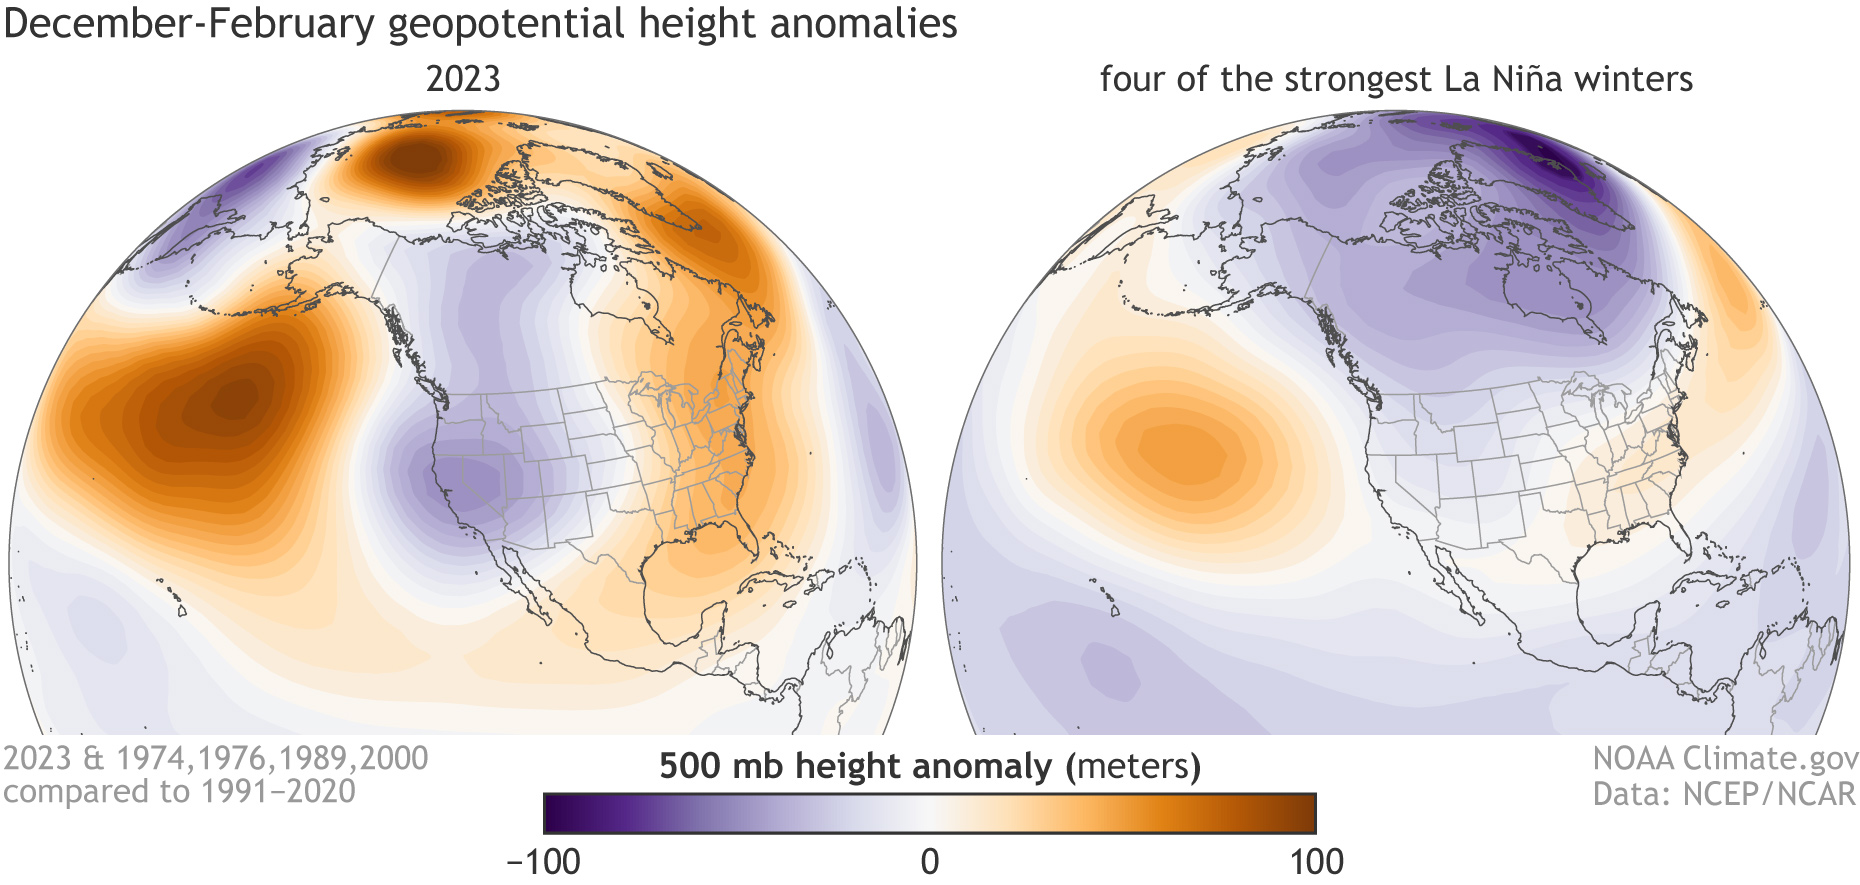
These maps show how this winter's pressure anomalies (left) did resemble the typical pressure patterns during four of the strongest La Niñas on record (right). Both maps have a trio of alternating pressure anomalies stretching from the North Pacific to the eastern United States: high over the North Pacific (orange-brown), low over the West (purple), and high over the East (orange). But the exact boundaries and strength were a little off, and those small differences had a big influence on the precipitation outcome in parts of the West. Maps by NOAA Climate.gov, based on NCEP/NCAR reanalysis data from NOAA's Physical Science Lab.