
Image caption
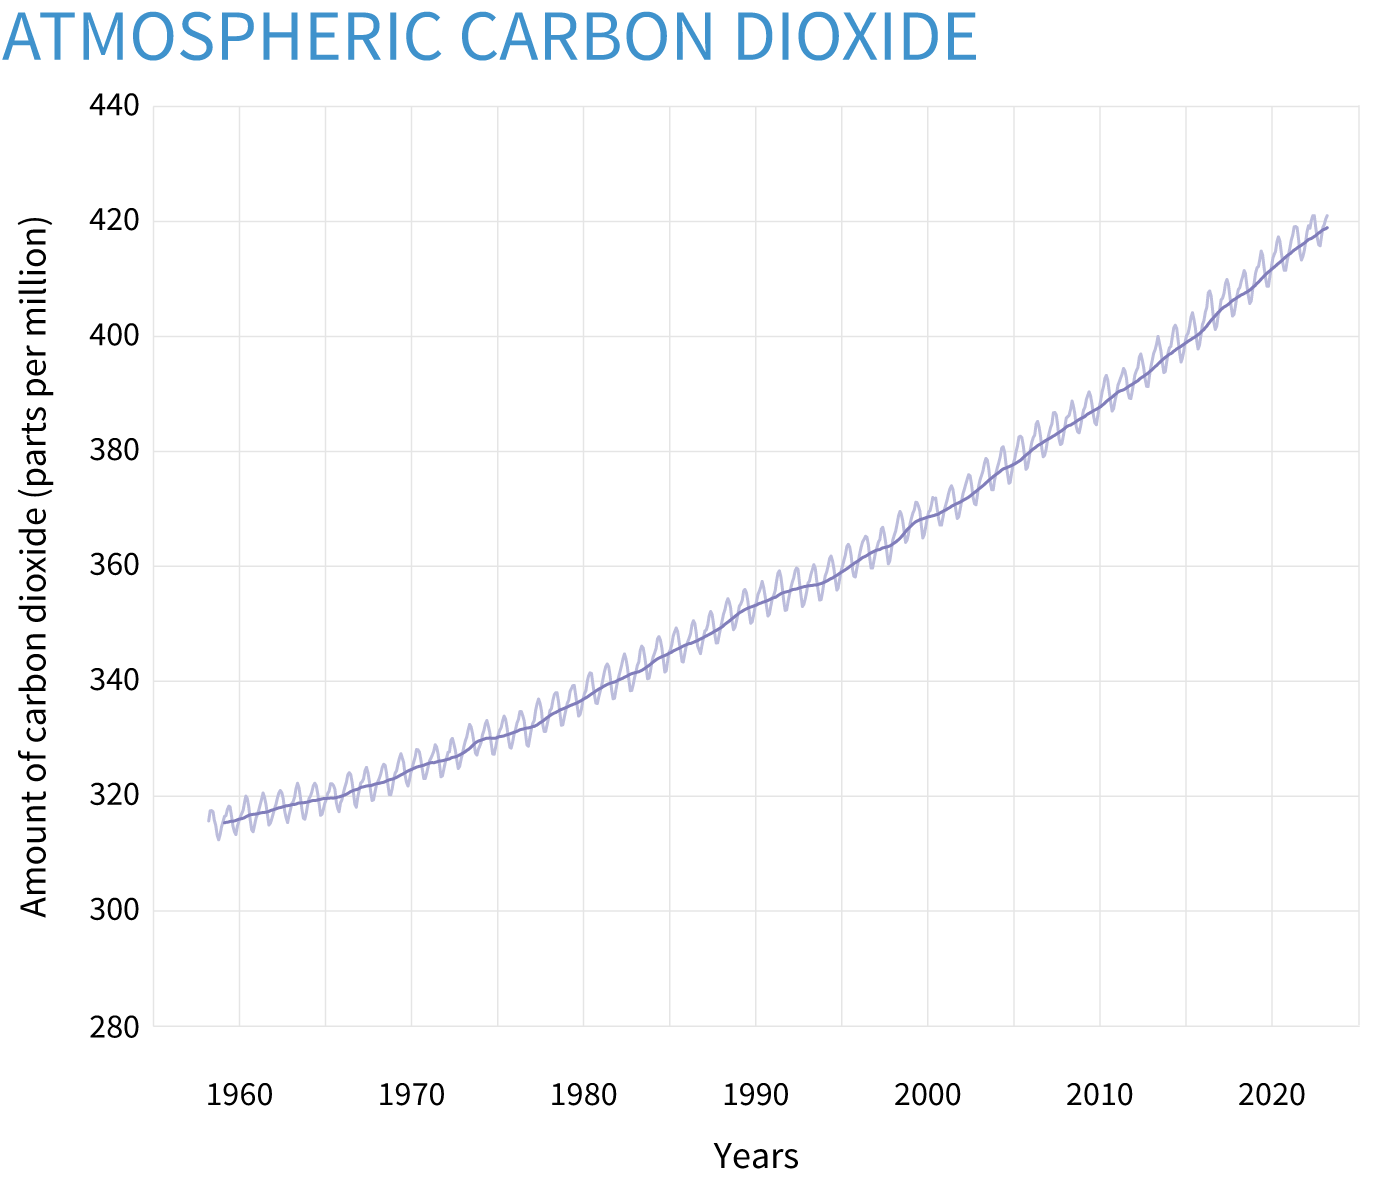
The modern record of atmospheric carbon dioxide levels began with observations recorded at Mauna Loa Observatory in Hawaii. This graph shows the station's monthly average carbon dioxide measurements since 1958 in parts per million (ppm). The seasonal cycle of highs and lows (small peaks and valleys) is driven by summertime growth and winter decay of Northern Hemisphere vegetation. The long-term trend of rising carbon dioxide levels is driven by human activities. NOAA Climate.gov image, based on Mauna Loa monthly mean data from NOAA Global Monitoring Lab.