
Image caption
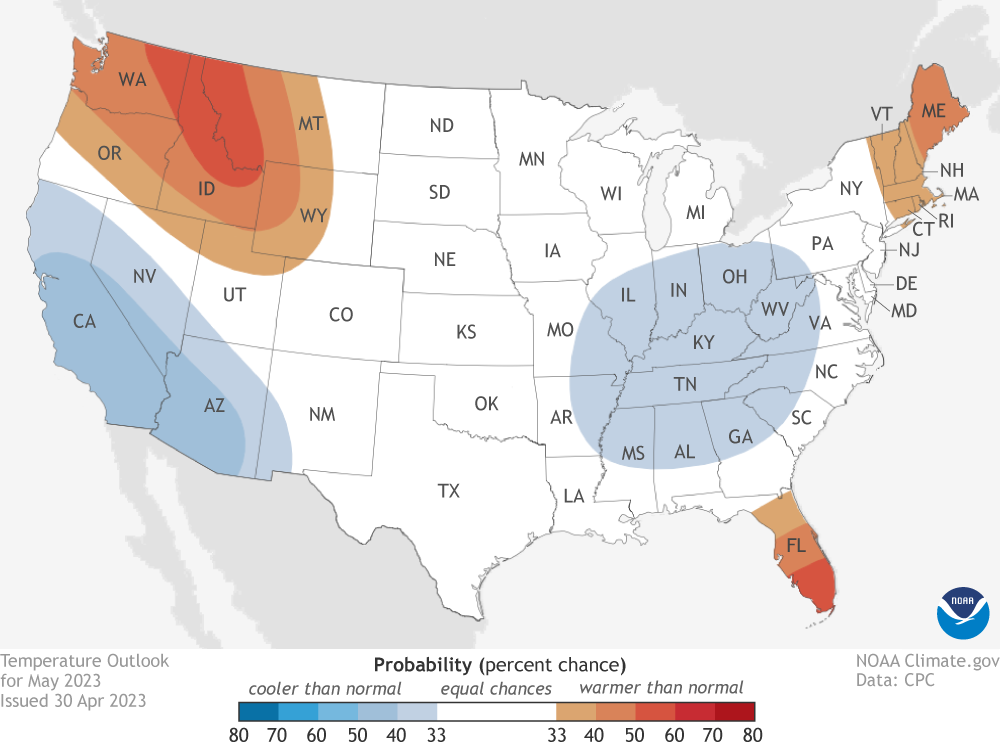
U.S. map showing the favored temperature outcome for May 2023 for each part of the contiguous United States (view Alaska). Warm colors indicate much warmer than average temperatures are favored, while cool colors mean much cooler than average temperatures are favored. White areas mean equal chances for above- near-, or below average temperatures. NOAA Climate.gov map, based on data from NOAA Climate Prediction Center.