
Image caption
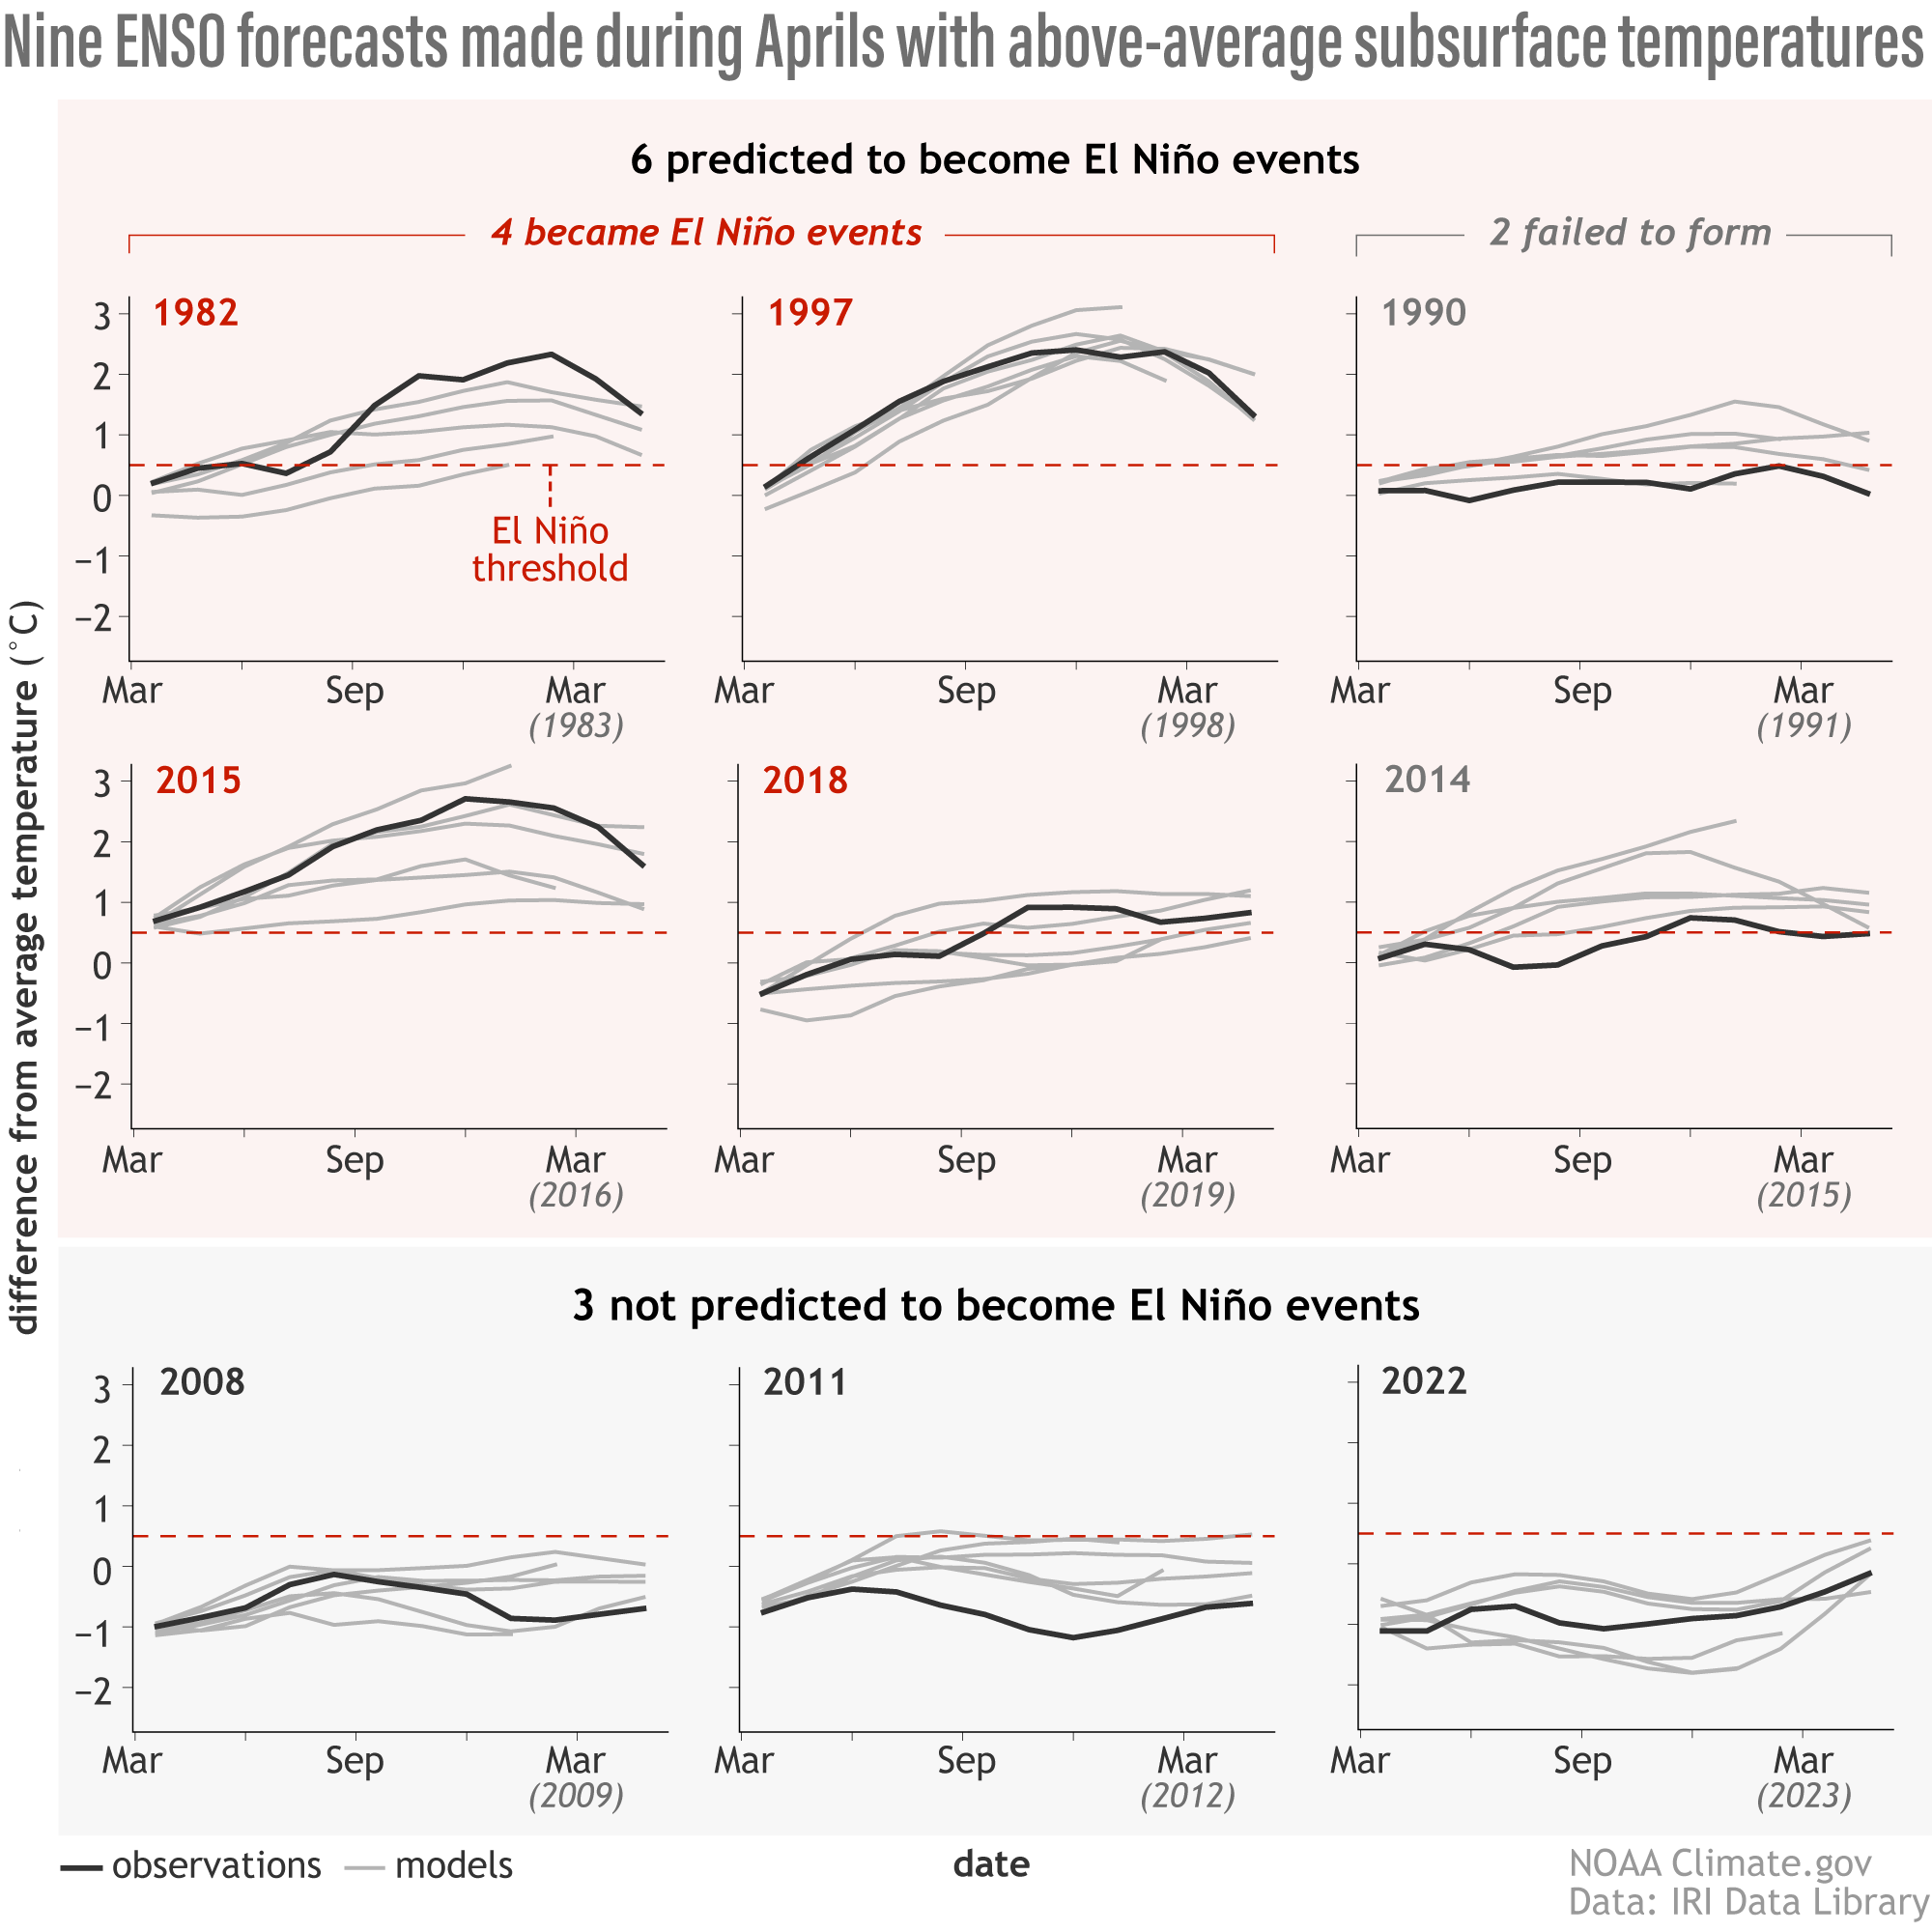
Model forecasts (light gray lines: means from the North American Multi-model Ensemble) and observations (black lines: ERSSTv5 temperature data) of ENSO as measured by the Niño-3.4 index. Years are selected based on the nine largest April values of subsurface warm water volume anomalies (0-500 meters below the surface) of the tropical Pacific Ocean (120E-80W). Subsurface data based on TAO buoys. Figure provided Aaron Levine and modified by Climate.gov.