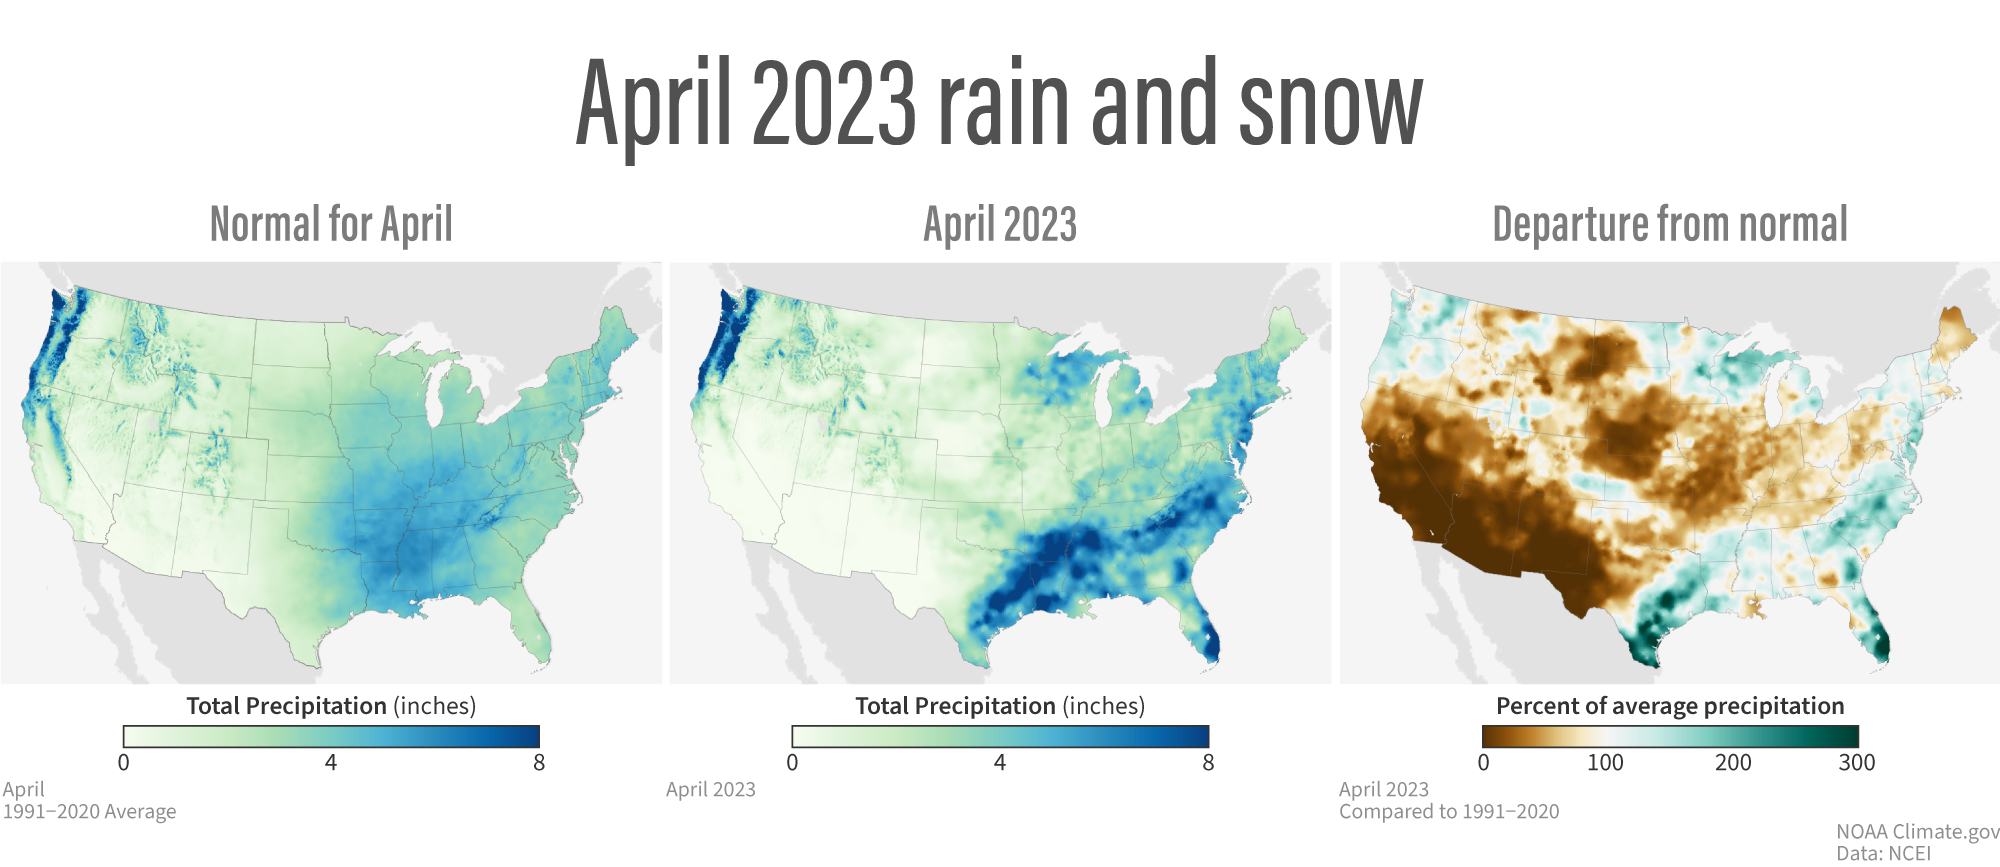
Image caption
(left) Long-term average—"normal"—precipitation (rain and snow combined) for April based on observations from 1991-2020. (middle) Total precipitation for April 2023. (right) How April 2023 precipitation compared to normal. Places that received less than 100 percent of average precipitation are colored in shades of brown, and places that received more than 100 percent of average precipitation are colored in shades of blue-green. NOAA Climate.gov maps, based on data from NOAA National Centers for Environmental Information.