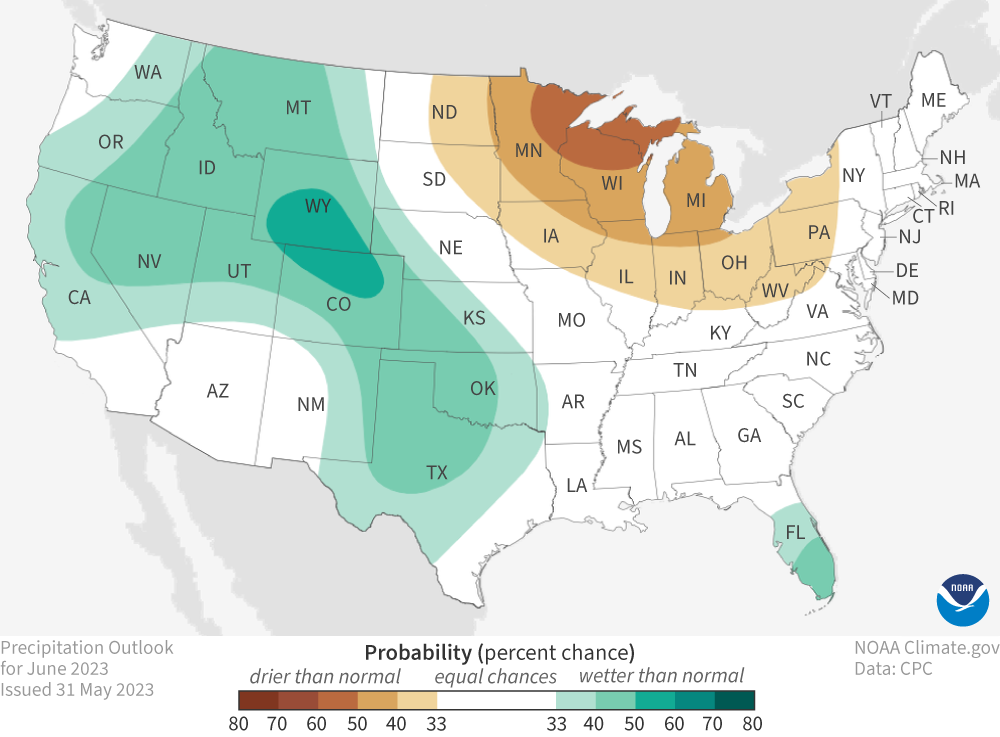
Image caption
The U.S. precipitation outlook for June 2023 (view Alaska), showing places where a much wetter than average June is favored (greens) and where a much drier than average June is favored (browns). White areas indicate that there are equal chances for a wet, dry, or near-average June. For more details on how to interpret these maps, read our explainer Understanding NOAA's monthly climate outlooks. Map by NOAA Climate.gov, based on data from the Climate Prediction Center.