
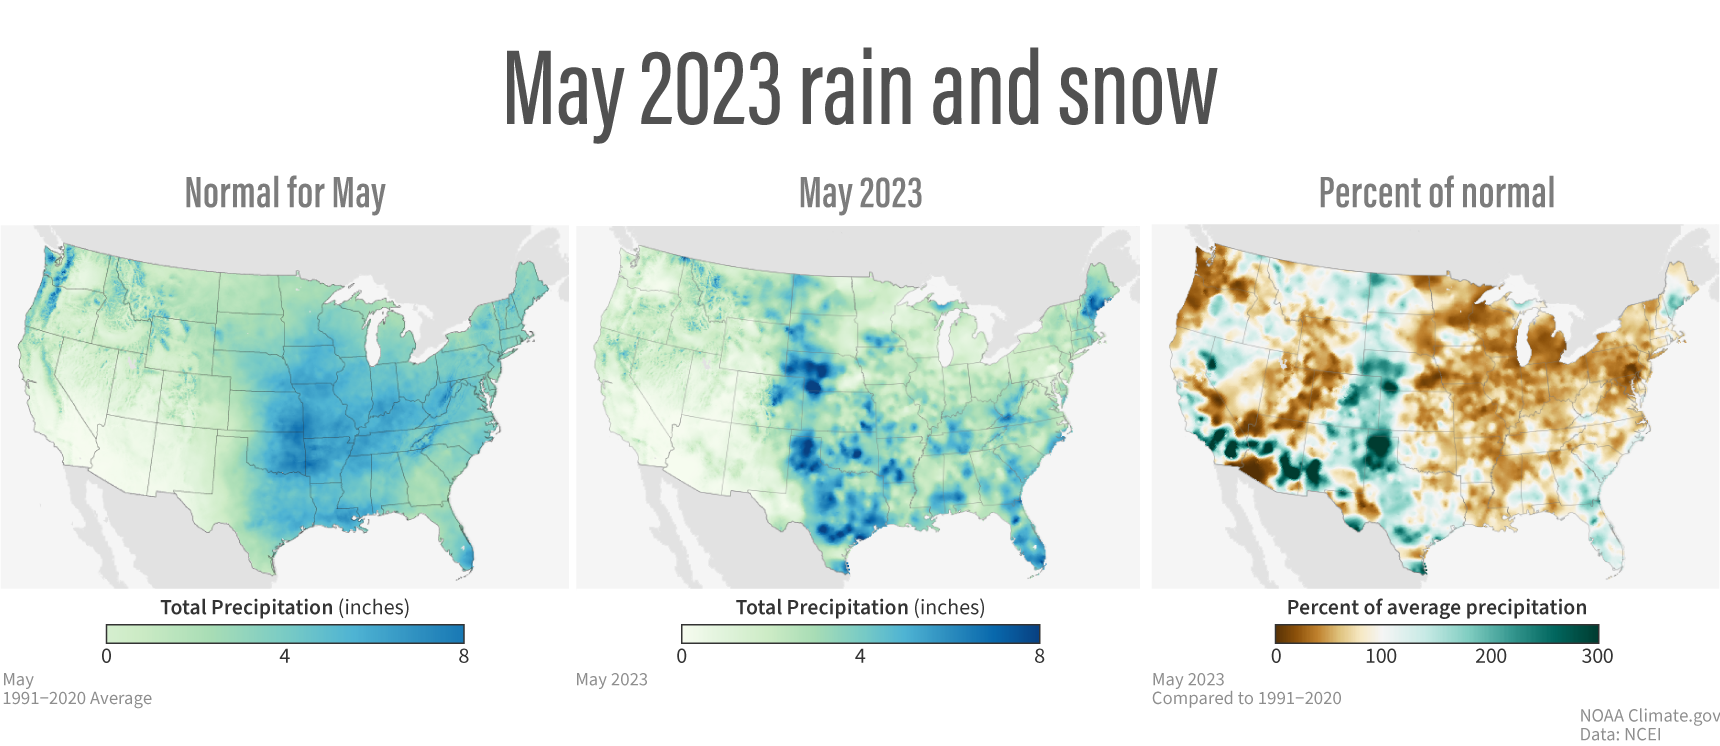
Image caption
(left) Average May precipitation for 1991–2020, with lower amounts of precipitation in yellow, and higher amounts of precipitation in blue. (center) Total precipitation in May 2023. (right) May precipitation as percent of normal, with places receiving less than 100 percent of their average May precipitation in brown, and places receiving more than 100 percent of their average precipitation in green. NOAA Climate.gov maps, based on data from NOAA National Centers for Environmental Information.