
Image caption
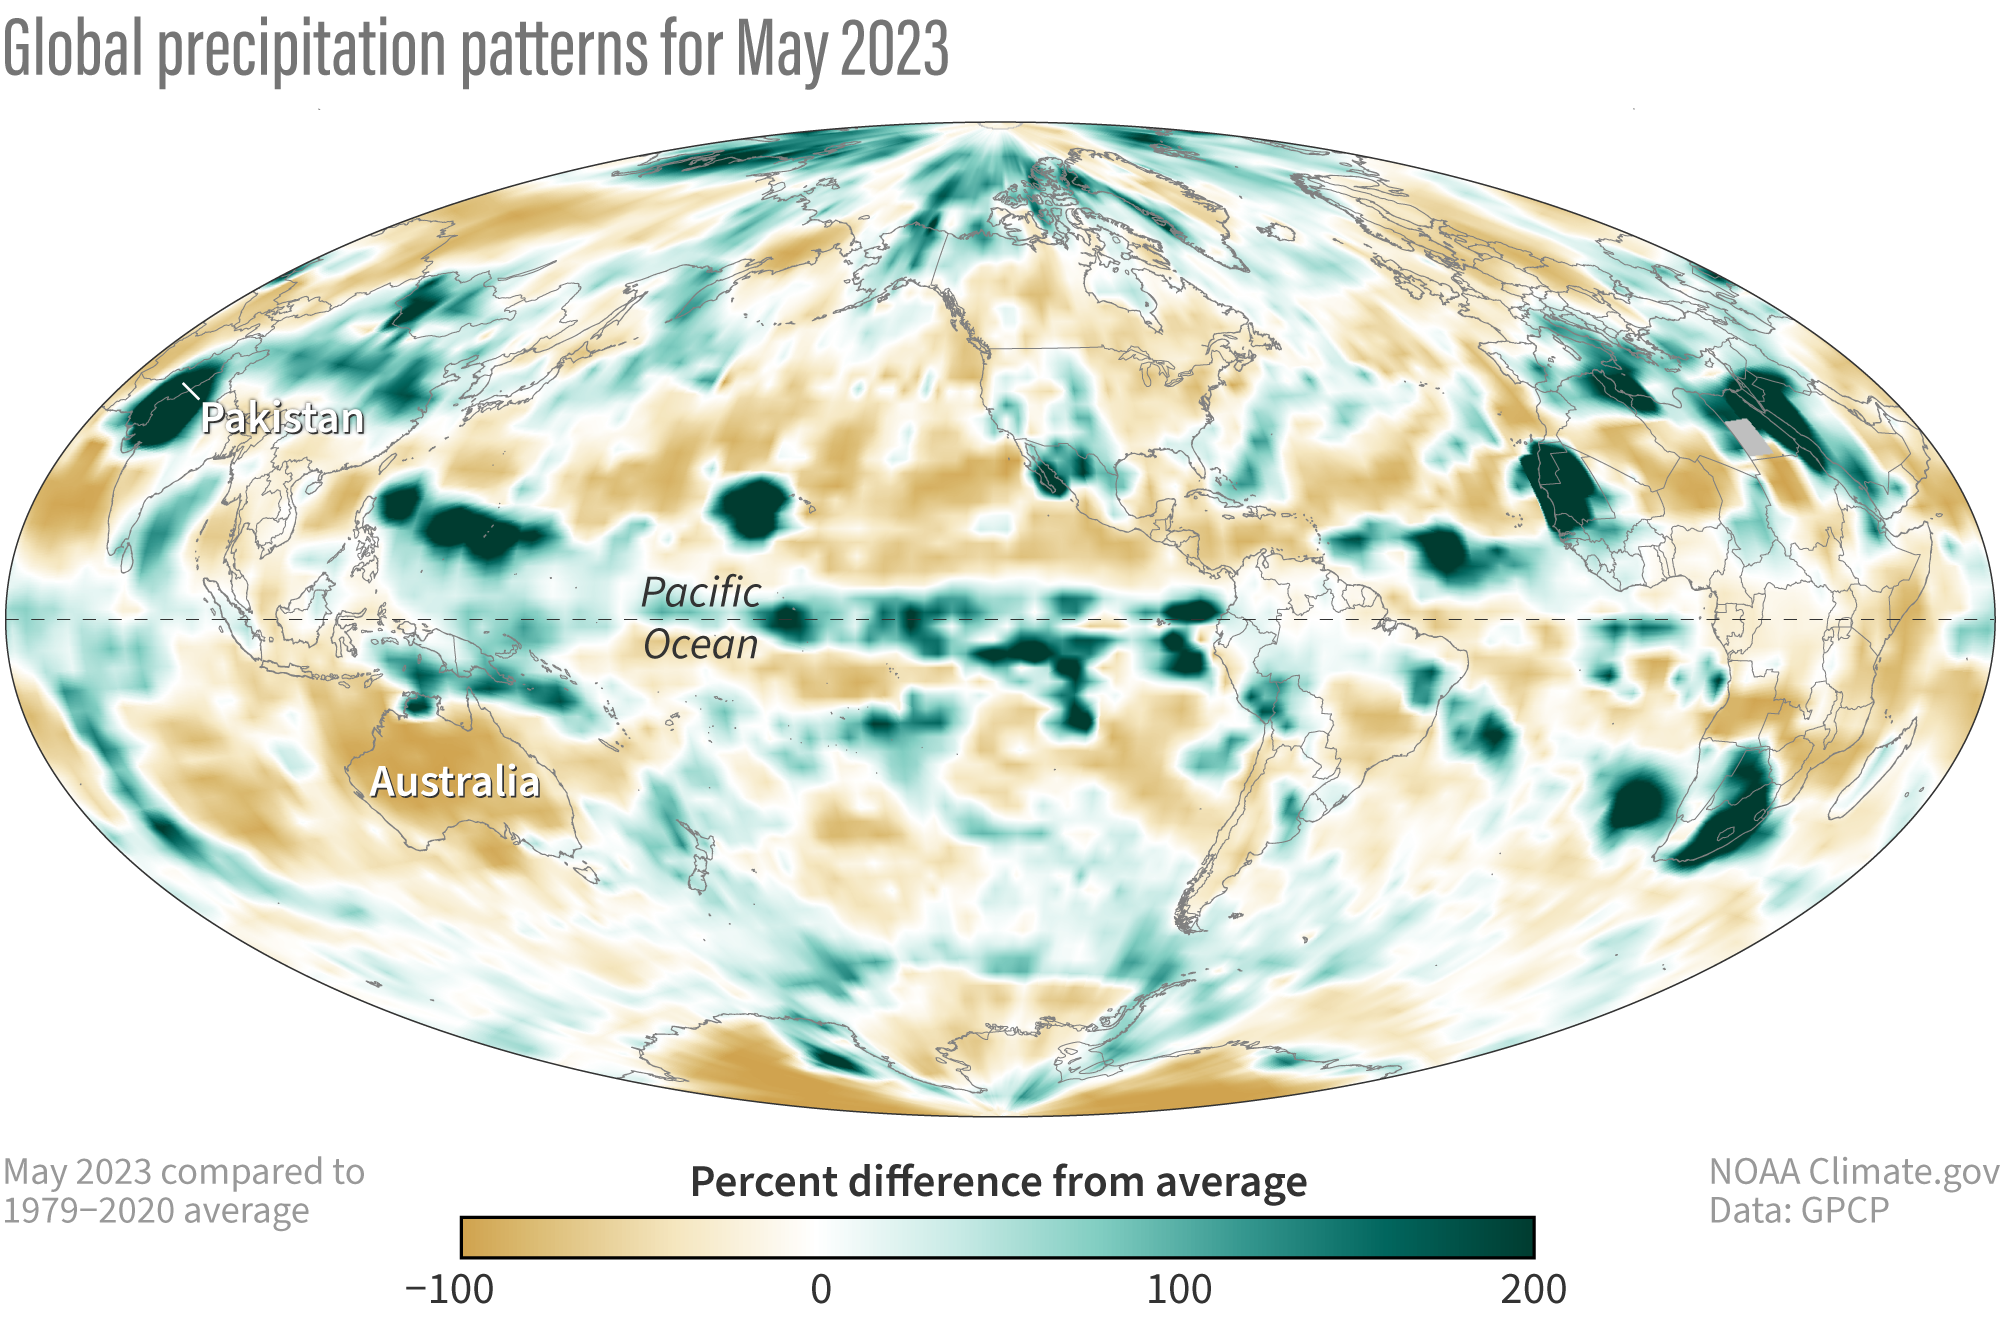
Precipitation around the world in May 2023, shown as a percent difference from average. Brown areas received up to 100 percent less than their normal May precipitation; green areas received 200 percent or more than their normal May precipitation. NOAA Climate.gov Map, based on data from the Global Precipitation Climatology Project.