
Image caption
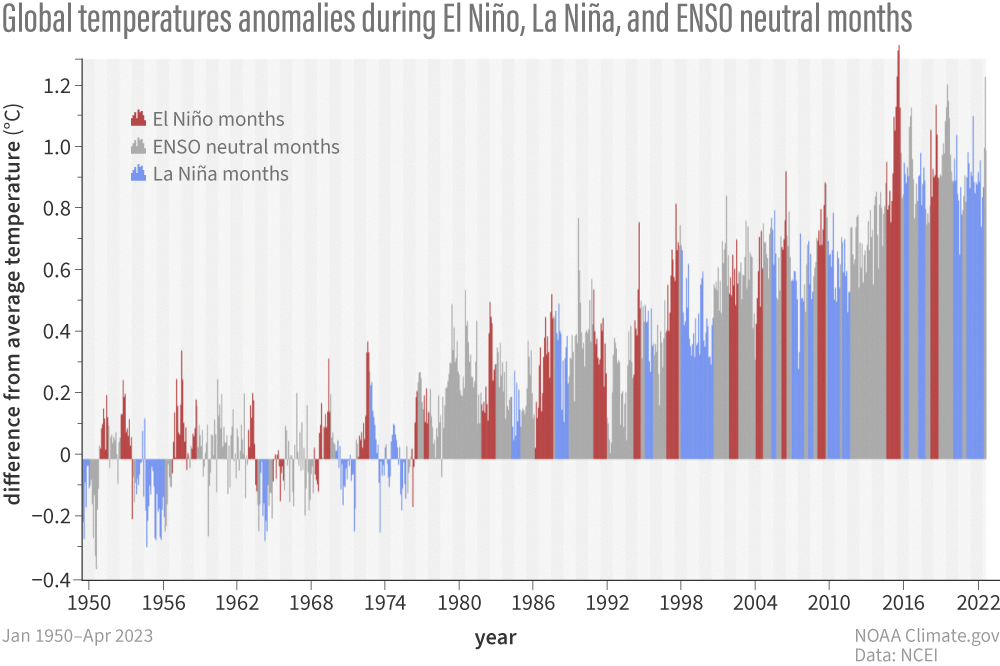
Monthly global surface temperature for January 1950–May 2023 compared to the 20th-century average, colored by monthly ENSO values. Recent decades are mostly warmer than earlier decades due to human-caused global warming. But compared to other months and years in the same decade, El Niño periods (red bars) tend to be warmer than La Niña periods (blue bars) in part because the tropical Pacific—a very large area of Earth’s surface —is well above average during El Niño. NOAA NCEI image.