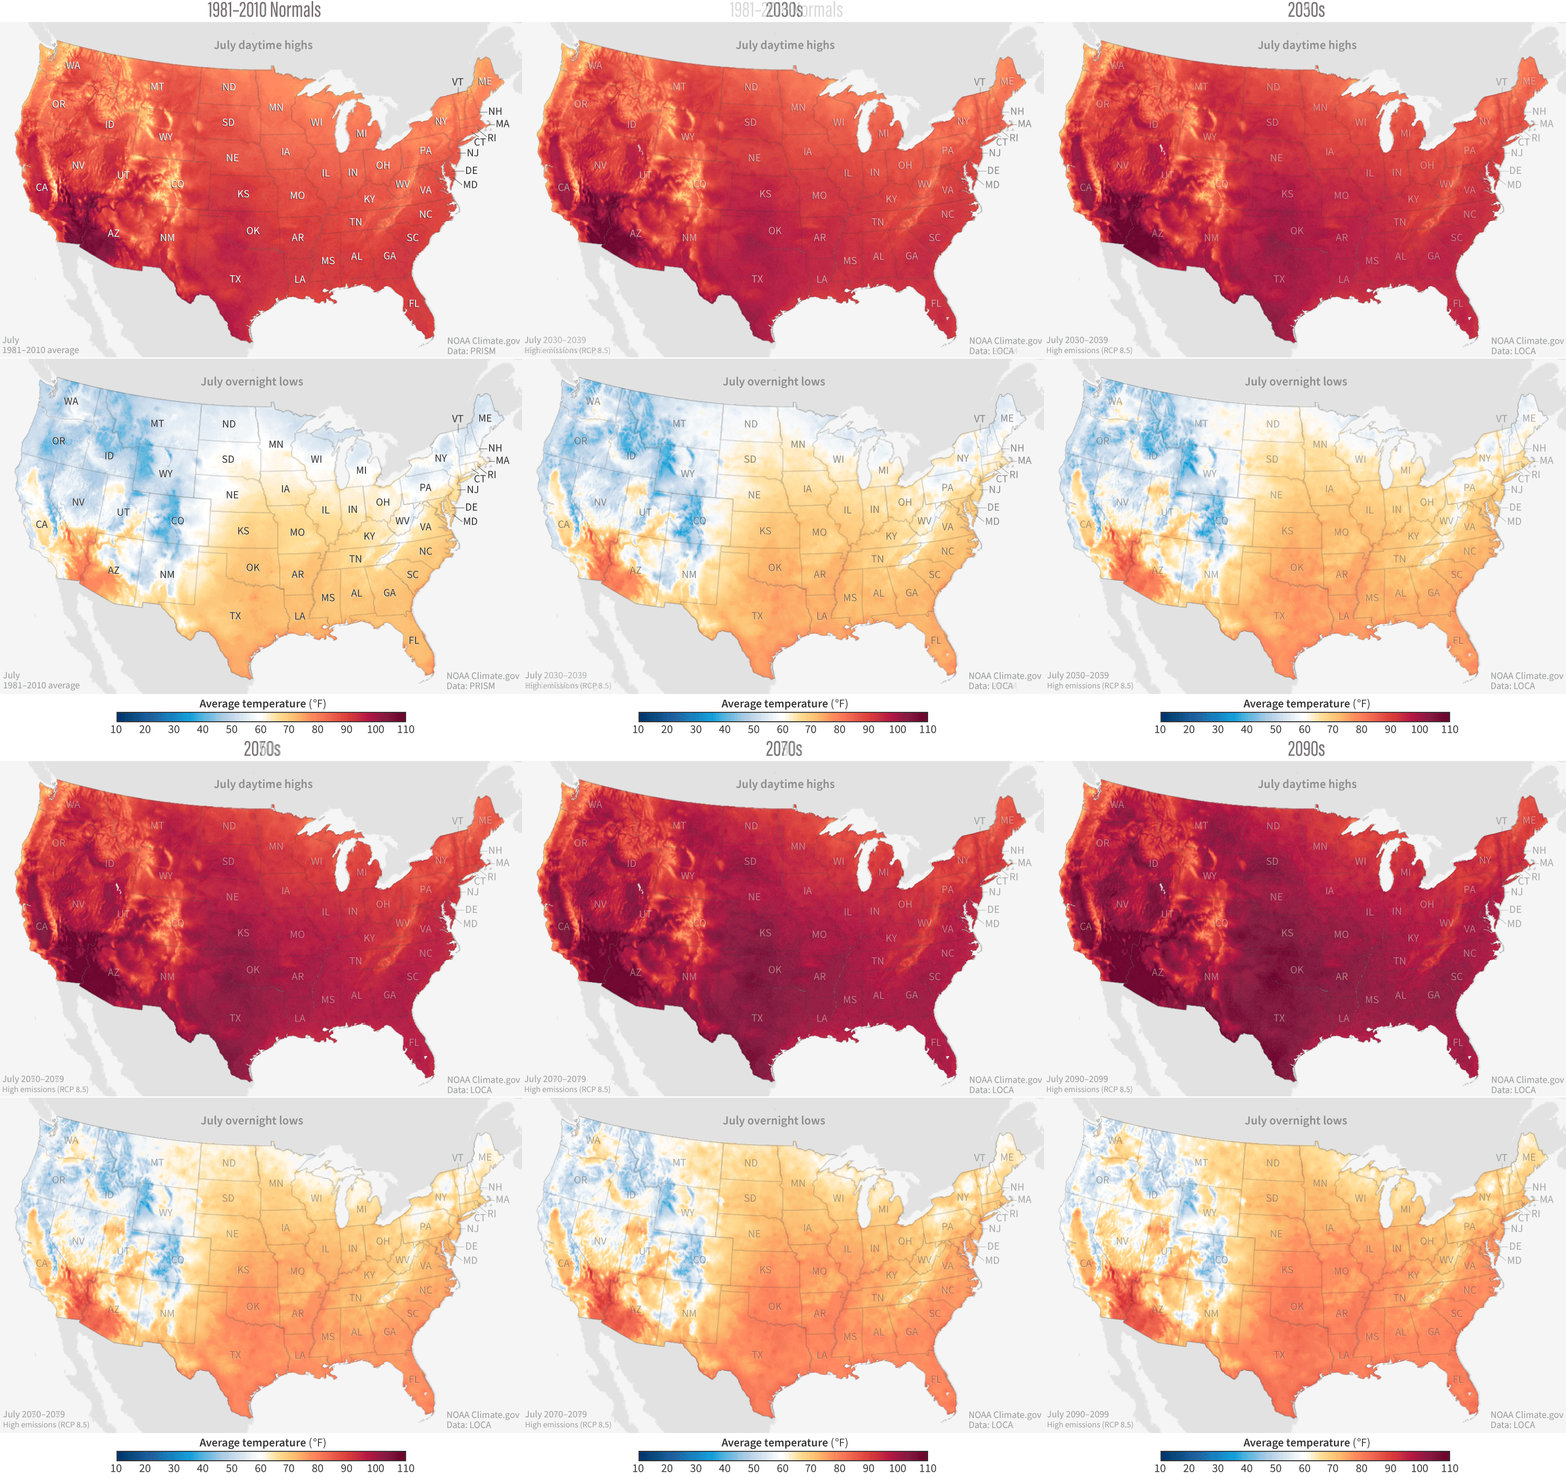
Image caption
Average daytime high (top) and overnight low (bottom) temperatures in July (top) in the recent past (1981-2010) and in future decades (2030s, 2050s, 2070s, and 2090s) if the world follows a pathway with high greenhouse gas emissions in the coming century. NOAA Climate.gov images from our Data Snapshots collection, based on CMPI5/LOCA data.