
Image caption
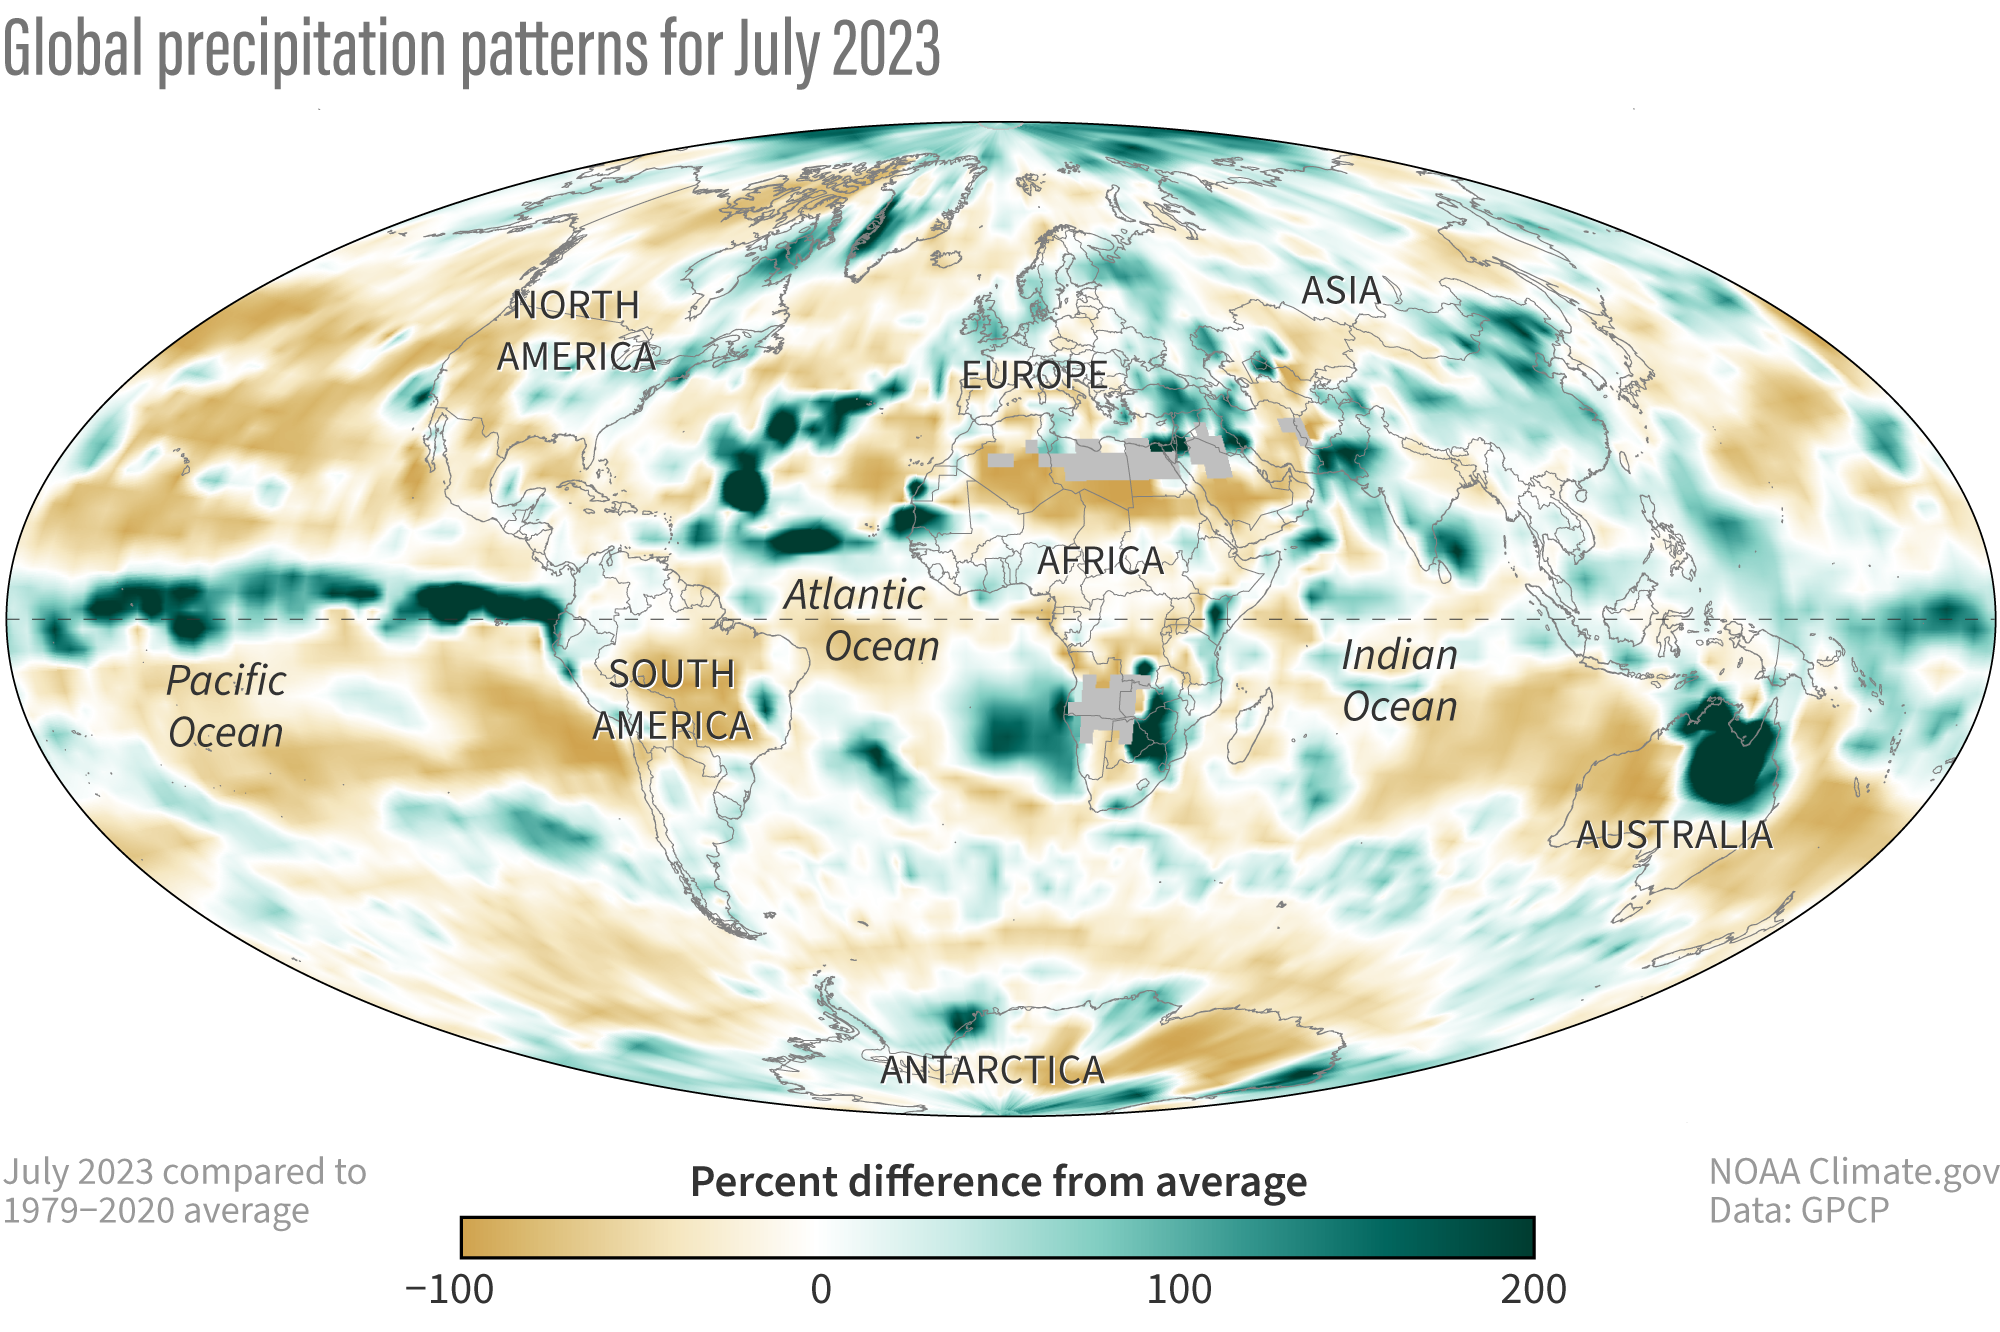
Precipitation in July 2023 shown as percent difference from the long-term average. Places that received more than 100 percent of their average precipitation are green, and places that received less than 100 percent of their average precipitation are brown. NOAA Climate.gov image, based on Global Precipitation Climatology Project data.