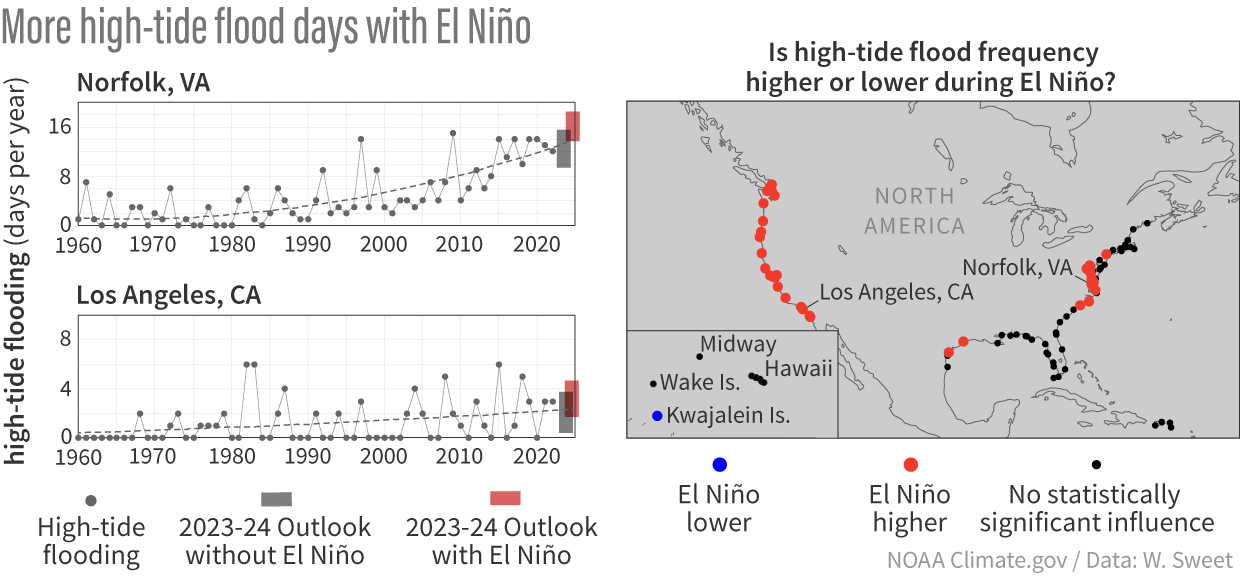
Image caption
(Left) Graphs of number of high-tide flooding days per year (gray line and dots) from 1960 through 2022 from NOAA tide gauges in Norfolk, Virginia (top), and Los Angeles, California, (bottom). The gray dashed line shows the long-term increasing trend (note the accelerating trend in Norfolk). The gray shading at the end of the time series indicates the likely range of values that would be predicted for 2023-24 based solely on extrapolating the long-term trend. The red shading indicates the official 2023-2024 Hide-Tide Flooding Outlook, which provides the ‘likely range’ of high-tide flooding days over the course of the year. The higher number of predicted flood days in the official outlook relative to the extrapolated trend reflects the expected effects of the predicted moderate-to-strong El Niño through the upcoming winter. (Right panel) Locations where El Niño influences annual high-tide flooding frequencies. Black dots represent locations with no statistically significant influence. Note that the El Niño influence varies slightly both spatially and through time, but not much--see previous NOAA High Tide Flood Outlook reports (listed in footnote 3). NOAA Climate.gov image, adapted form original by Billy Sweet.