
Image caption
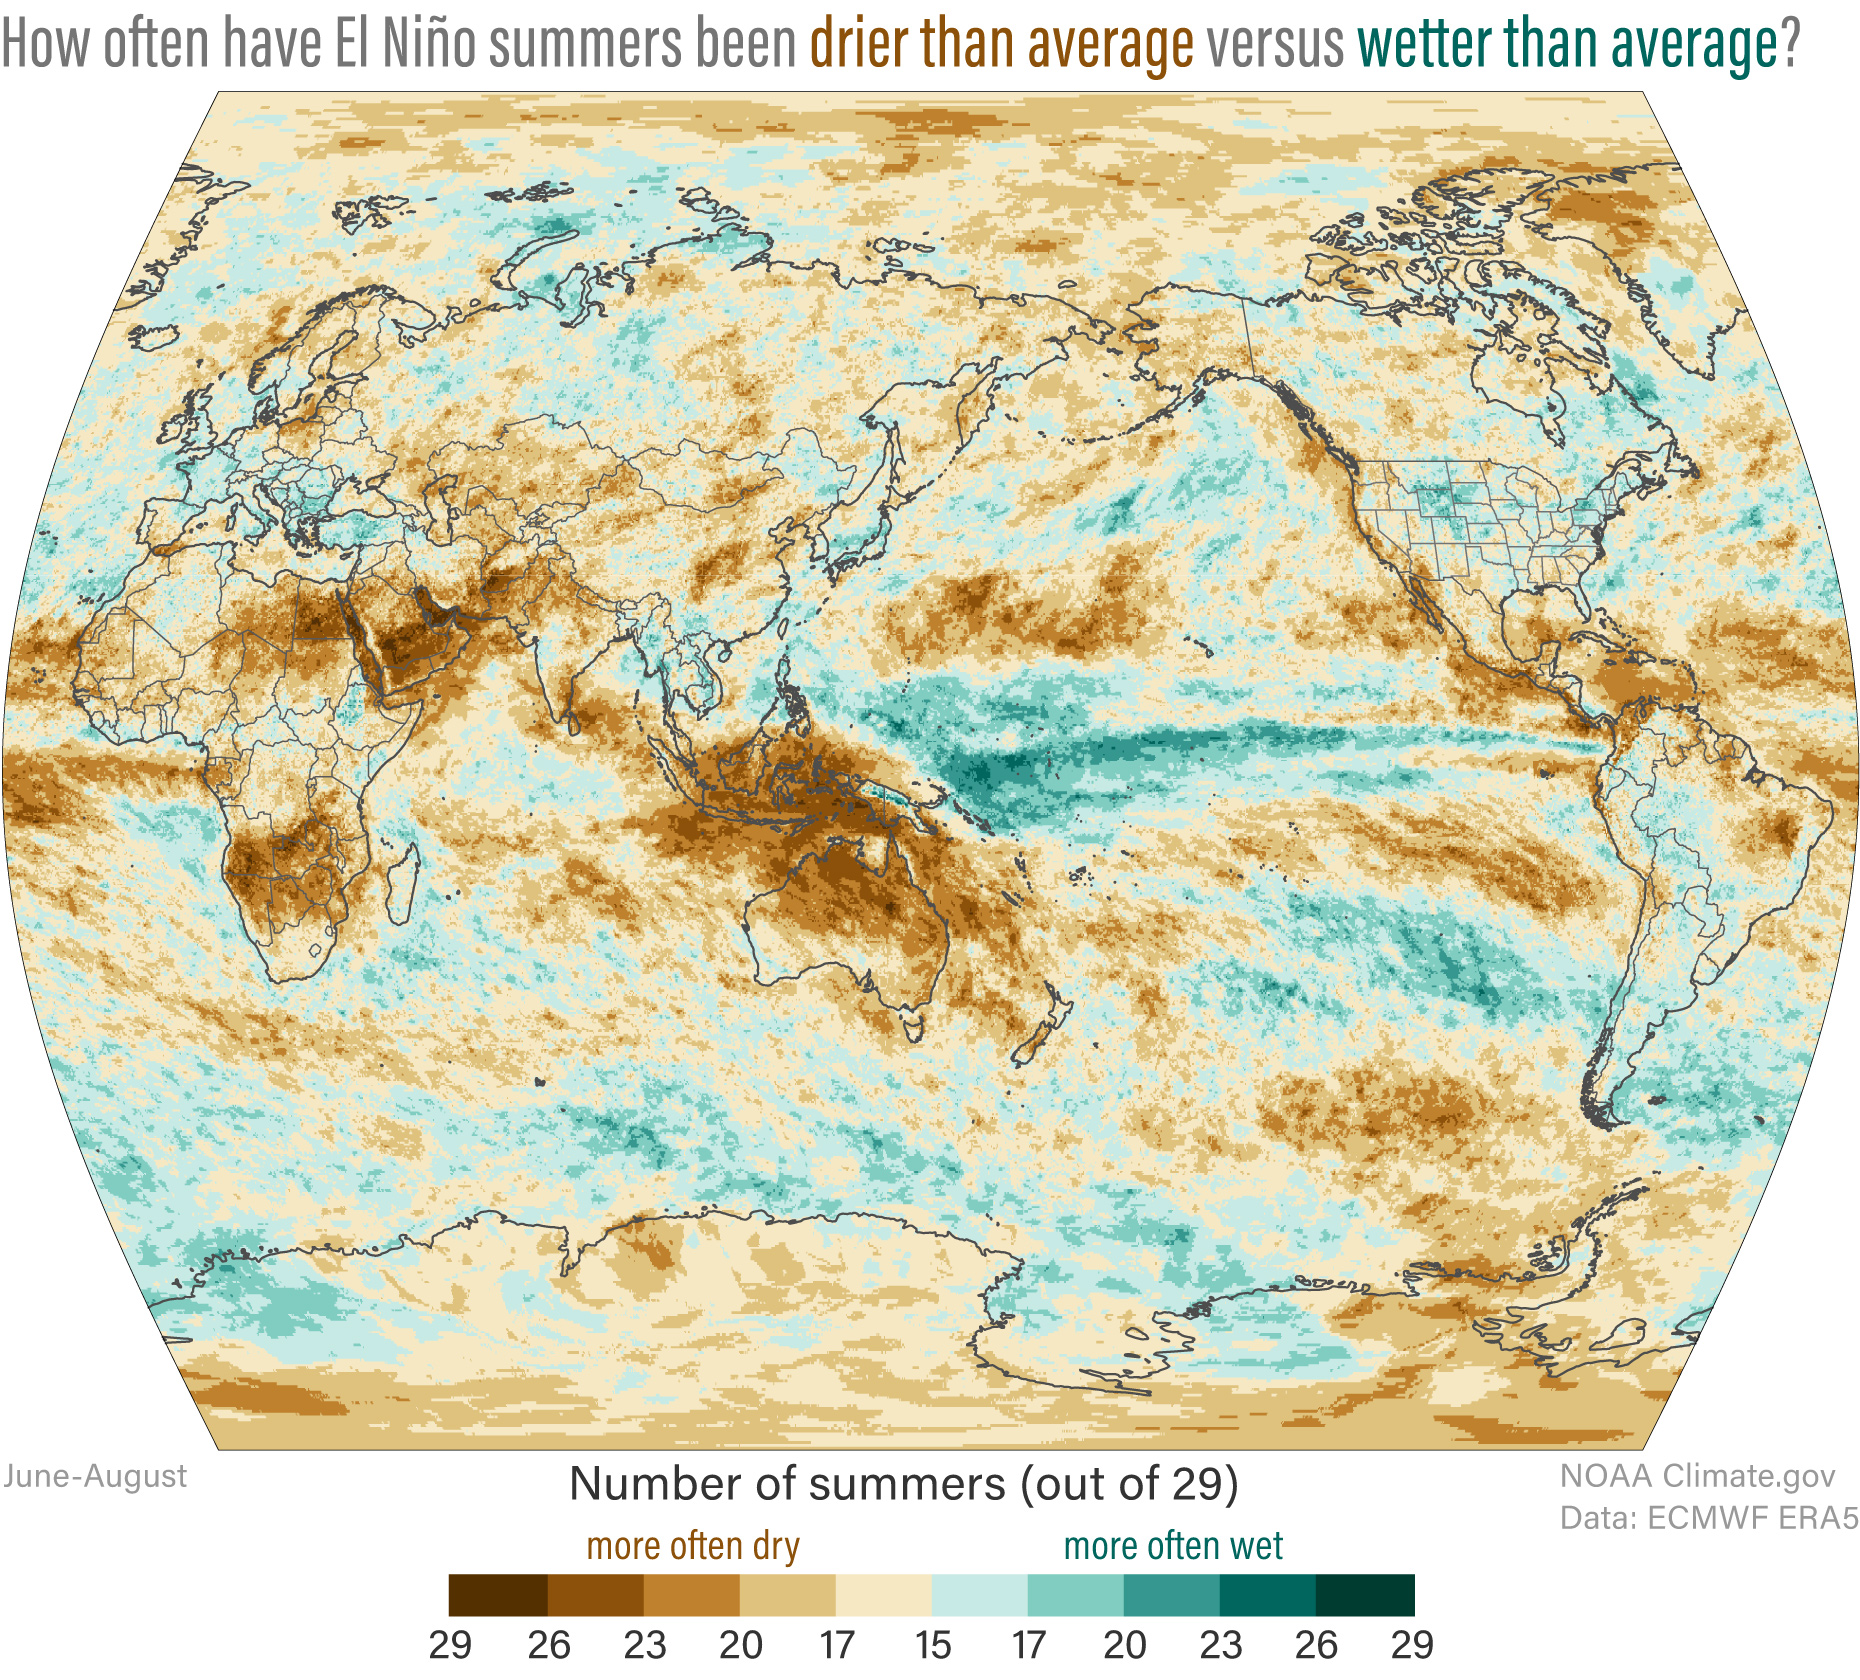
Out of 29 El Niño summers—any summer (June-August) preceding an El Niño winter (December-February)—on record, how many were wetter than average versus drier than average? This map shows places where wet El Niño summers outnumbered cool ones in blue-green colors, and places where dry El Niño summers outnumbered wet ones in brown. NOAA Climate.gov map, based on analysis by Brian Brettschneider, Alaska NWS.