
Image caption
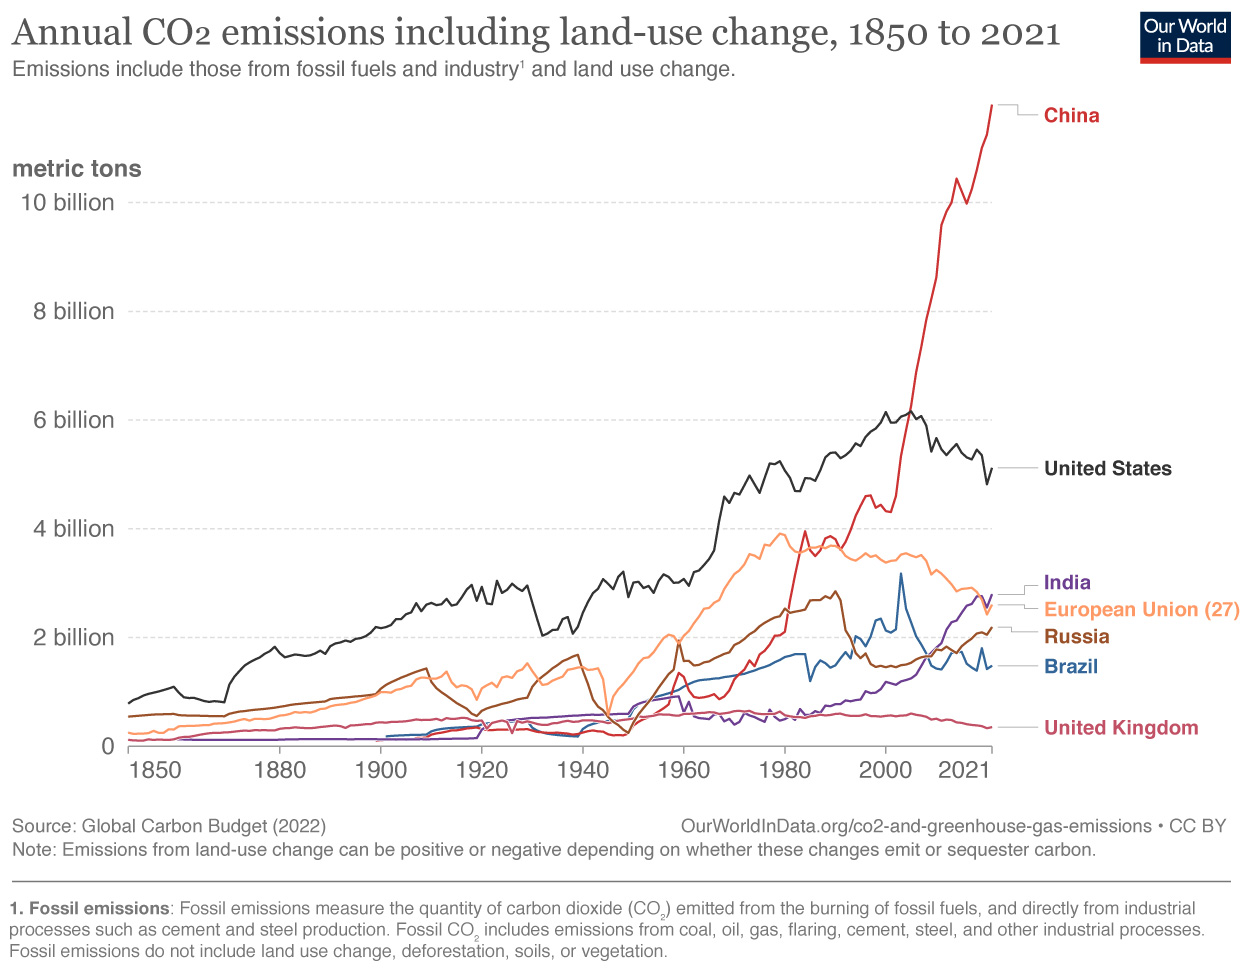
Annual carbon dioxide emissions from selected developed and developing countries from 1850-2021. Until the start of the new millennium in 2000, the United States (black line) emitted more carbon dioxide to the atmosphere each year than any other country, including all the countries of the European Union combined.(orange line). Since the mid-2000s, China's annual emissions (red line) have been the world's largest. Graph from Our World in Data, based on data from the Global Carbon Project.