
Image caption
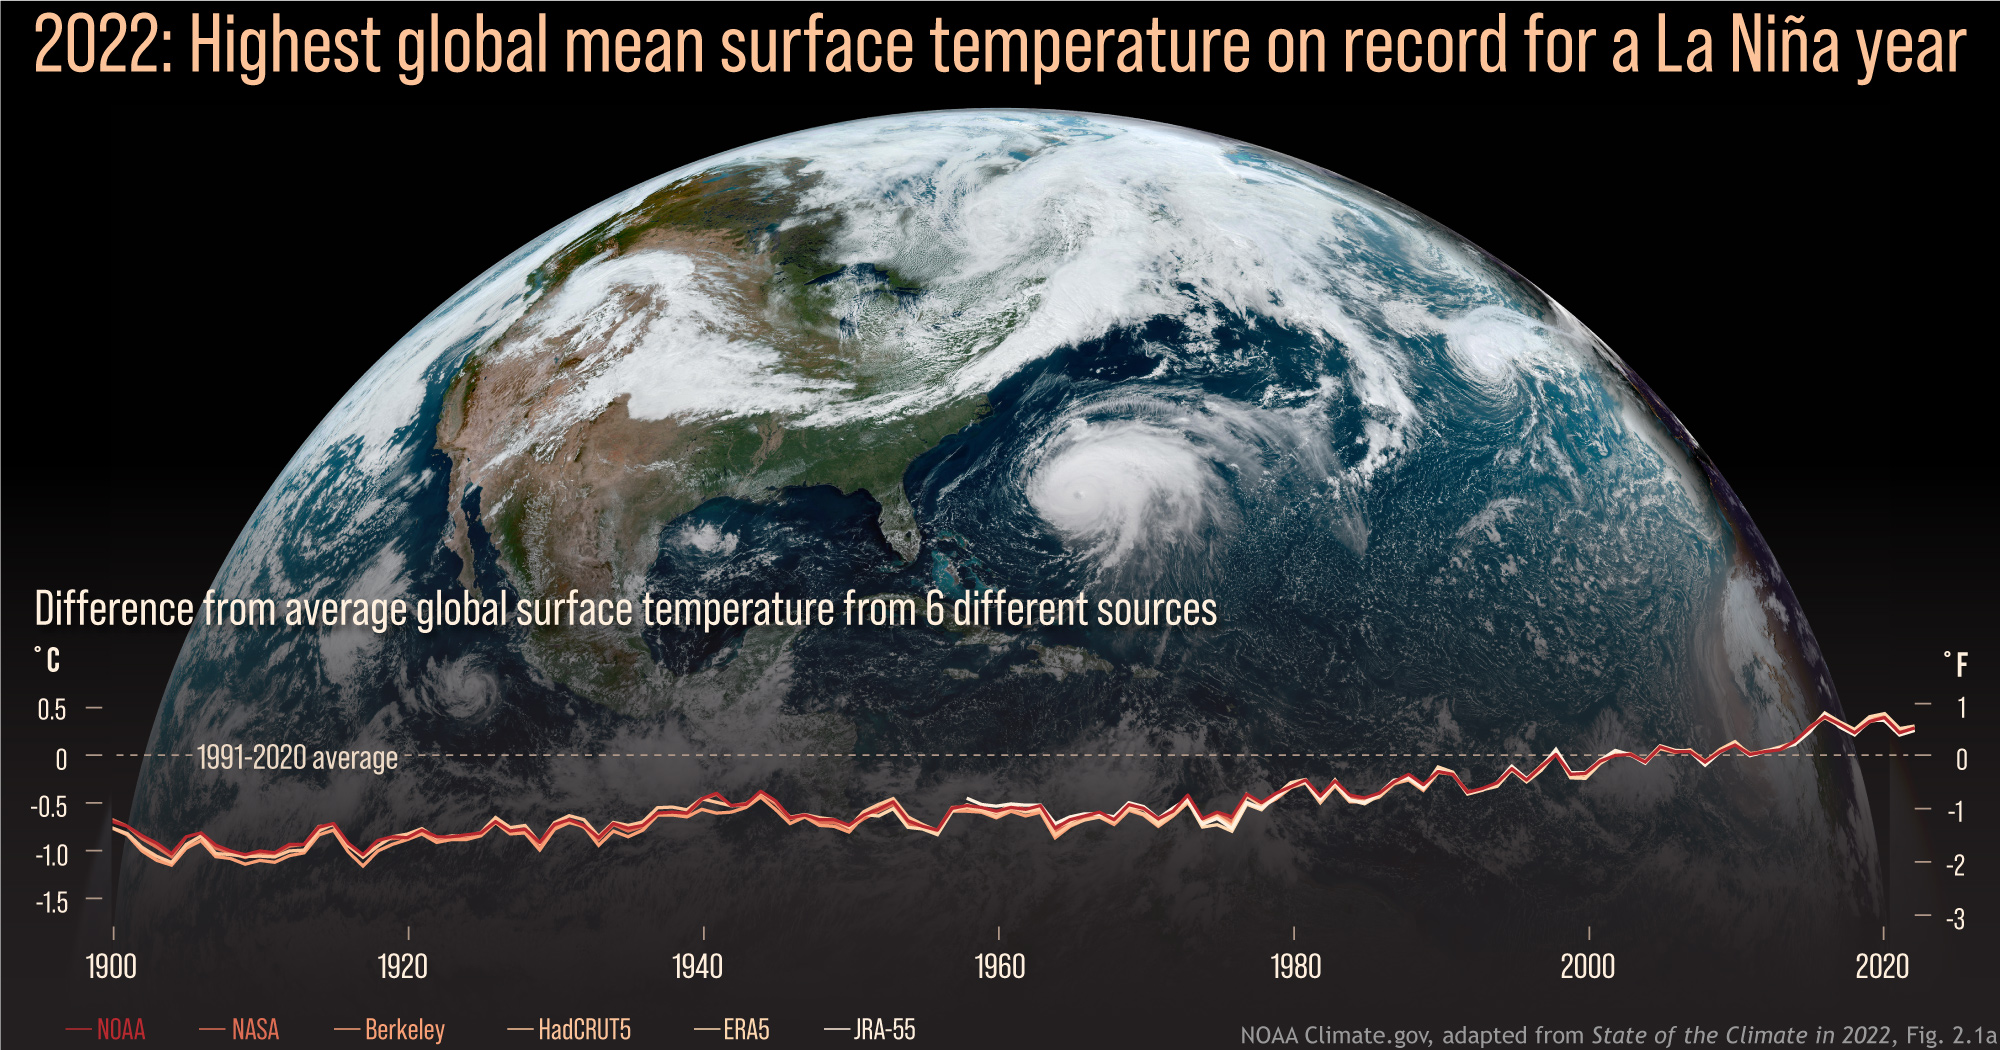
Graphs of yearly global surface temperature compared to the 1991-2020 average from 1900 to 2022, based on six different temperature records. Despite small differences among the records from year to year, all show a warming trend. The background image is a GOES-16 satellite image from September 22, 2022. NOAA Climate.gov image, adapted from Figure 2.1a in State of the Climate in 2022.