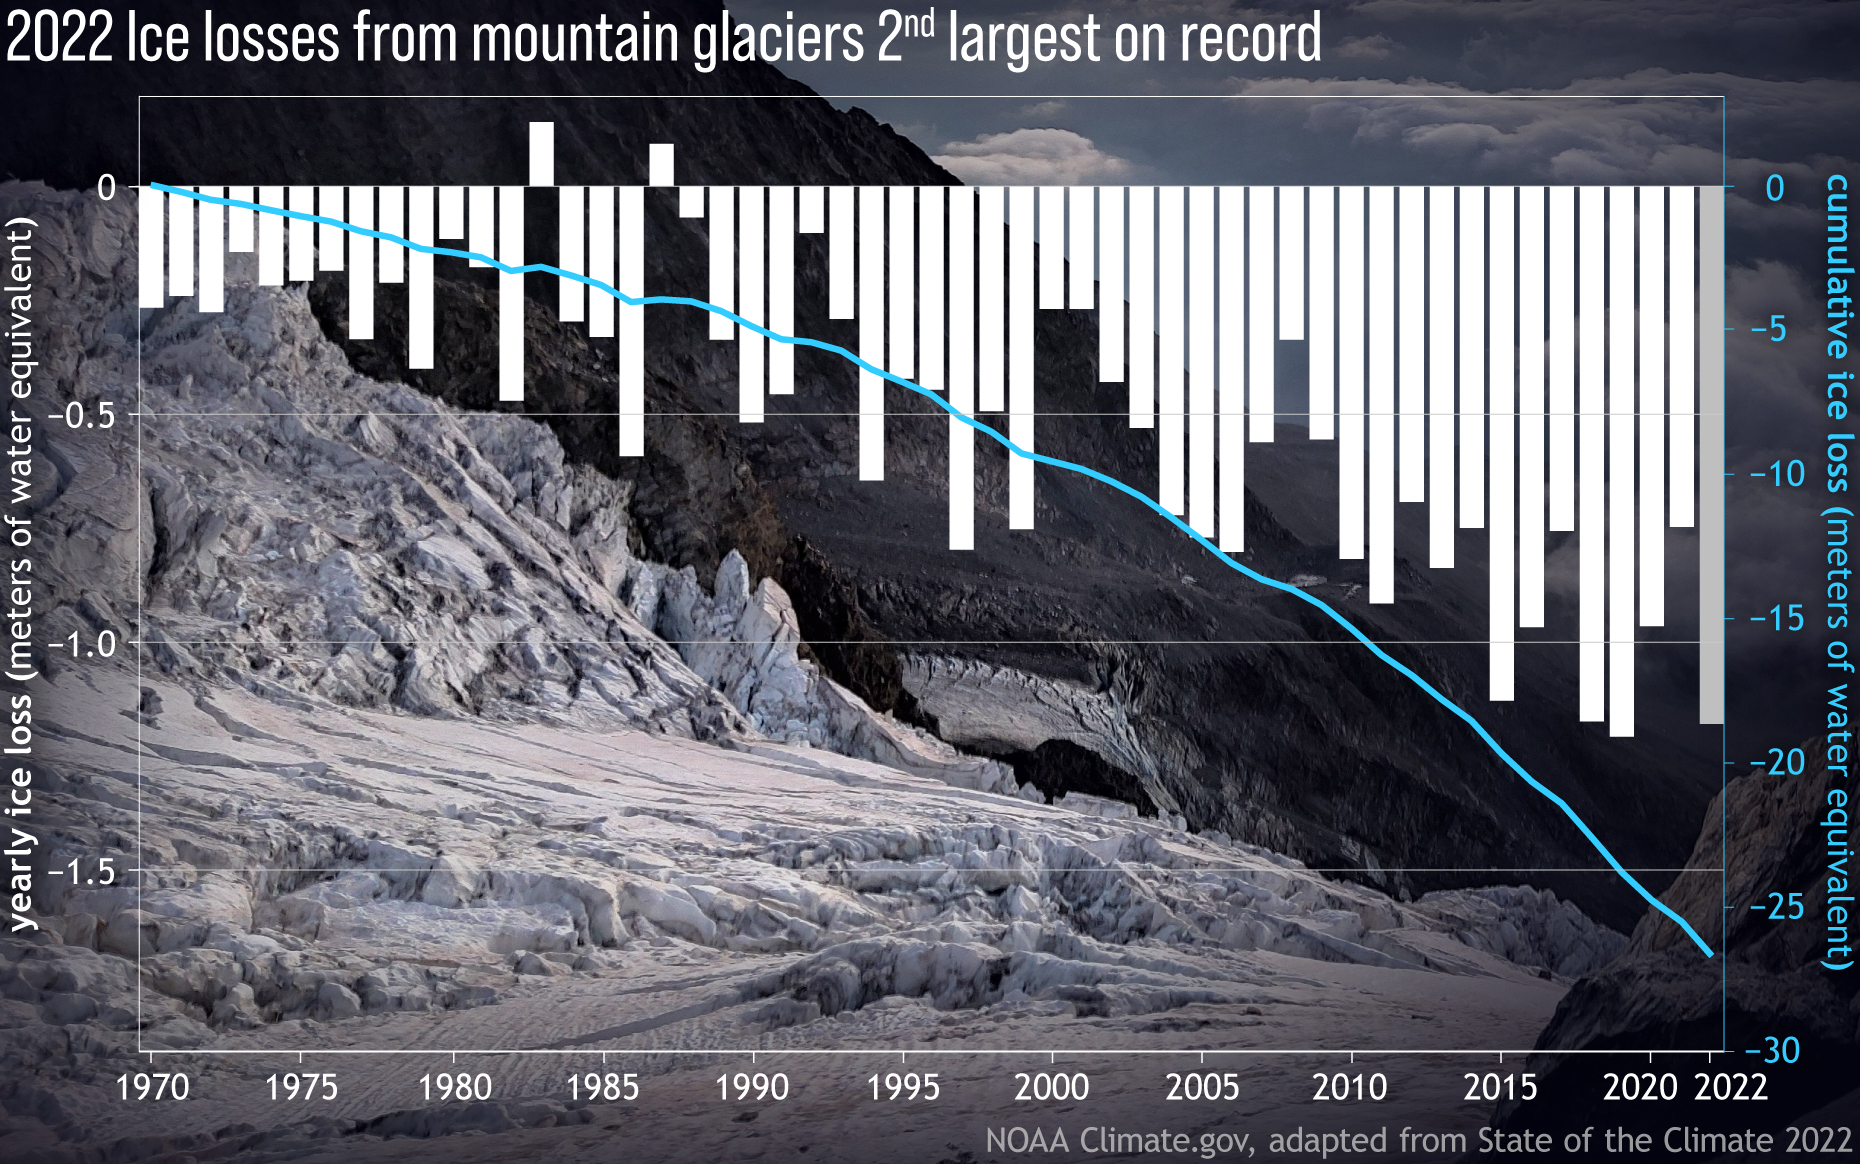
Image caption
Yearly ice gains or losses (bars) from the mountain glaciers in the World Glacier Monitoring Service's global reference network since 1970, with a line showing the cumulative losses over time (blue line). NOAA Climate.gov graphic, adapted from Figure 2.15 in State of the Climate in 2022. Background photo of Holbalhm Glacier in the Swiss Alps taken by Miguel Martín on Jul 24, 2022. Used under a Creative Commons license.