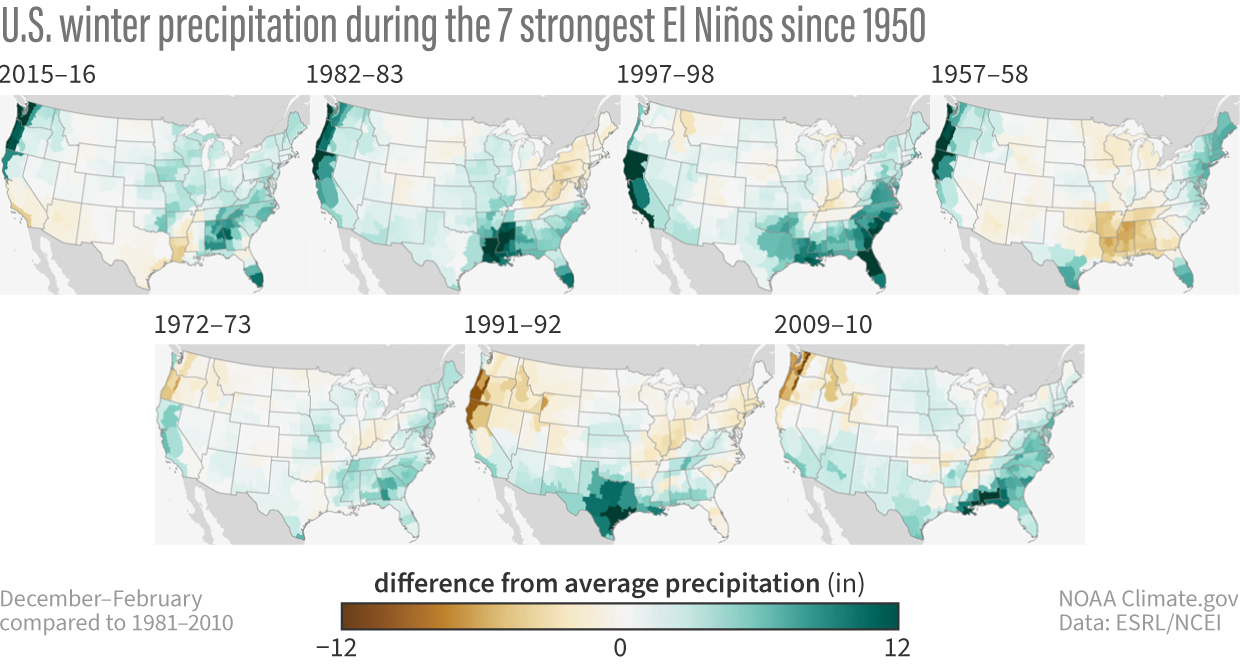
Image caption
U.S. winter (Dec-Feb) precipitation compared to the 1981-2010 average for the past 7 strong El Niño events. Details differ, but most show wetter-than-average conditions across some part of the South. NOAA Climate.gov image, based on data from NOAA Physical Science Lab online tool.