
Image caption
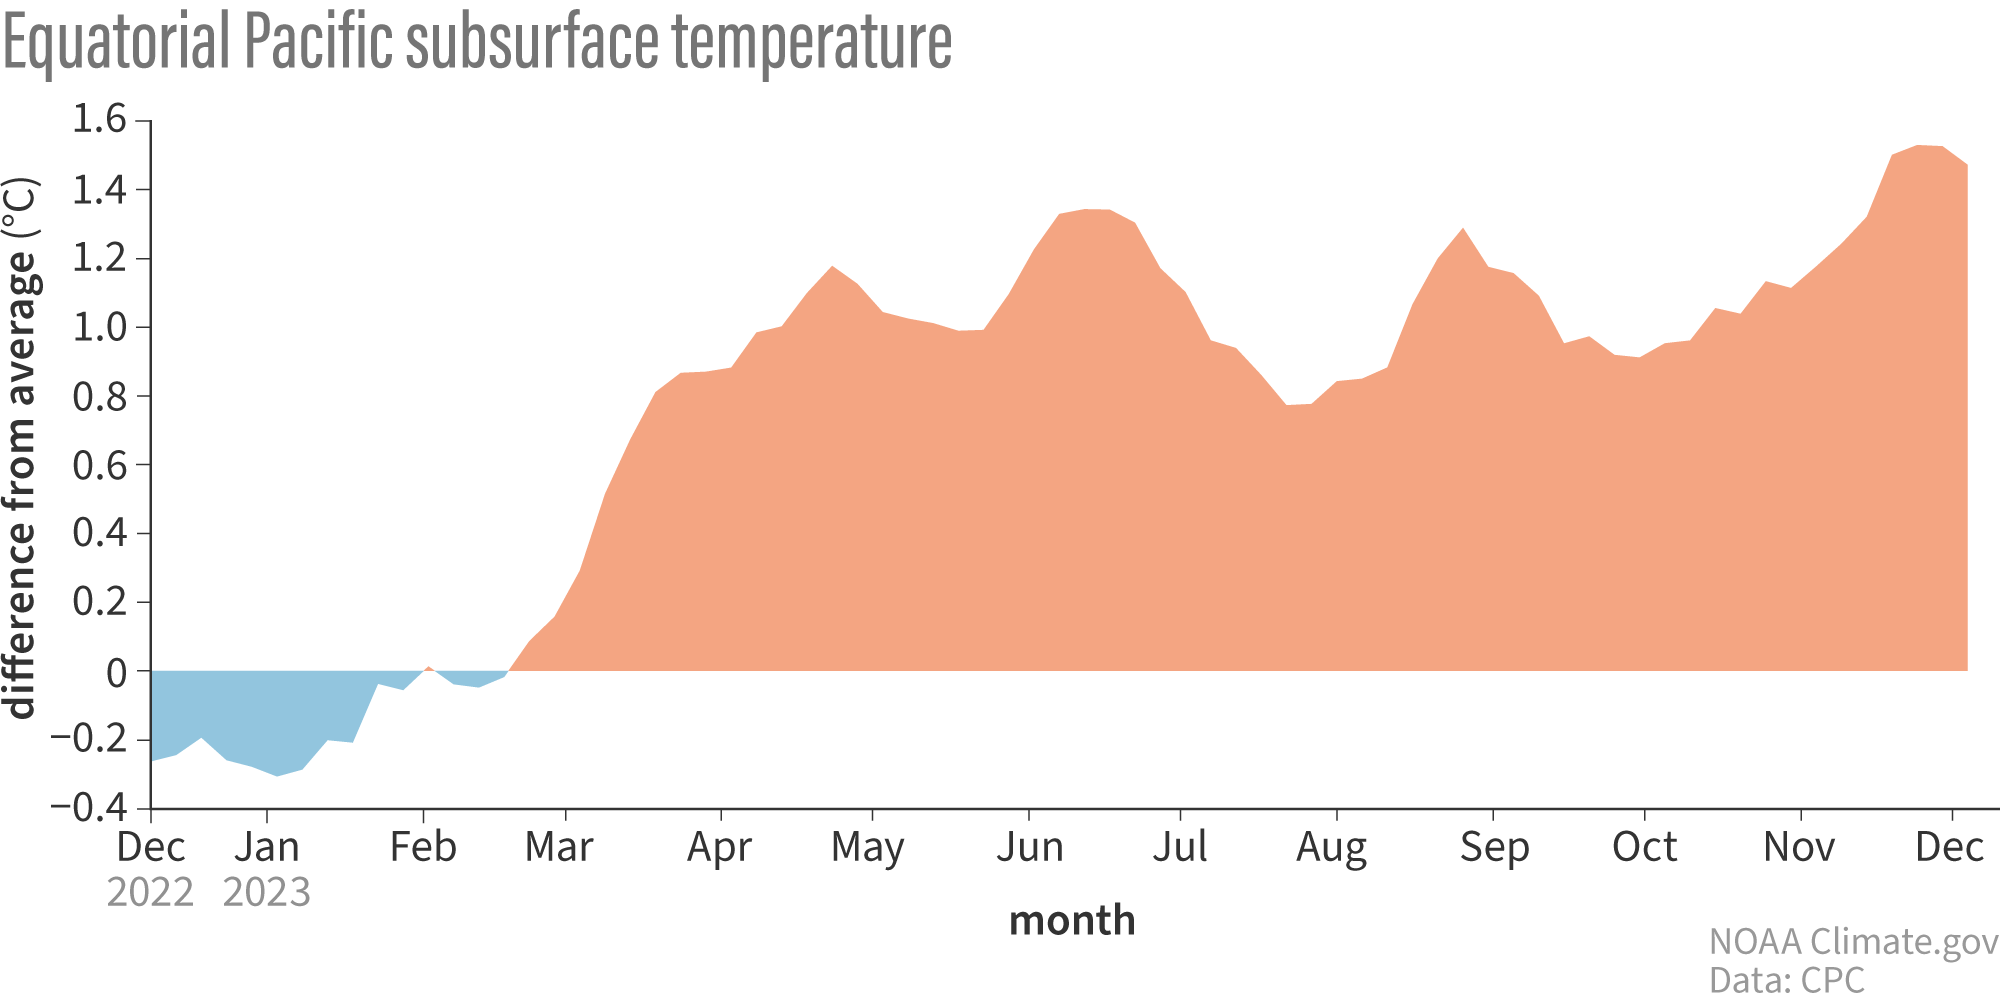
Graph showing the average temperature over the past year of the top 300 m (~1000 ft) of the Pacific Ocean, 180-100°W departure from the long-term (1991–2020) average. Graph by climate.gov from CPC data.
Graph showing the average temperature over the past year of the top 300 m (~1000 ft) of the Pacific Ocean, 180-100°W departure from the long-term (1991–2020) average. Graph by climate.gov from CPC data.