
Image caption
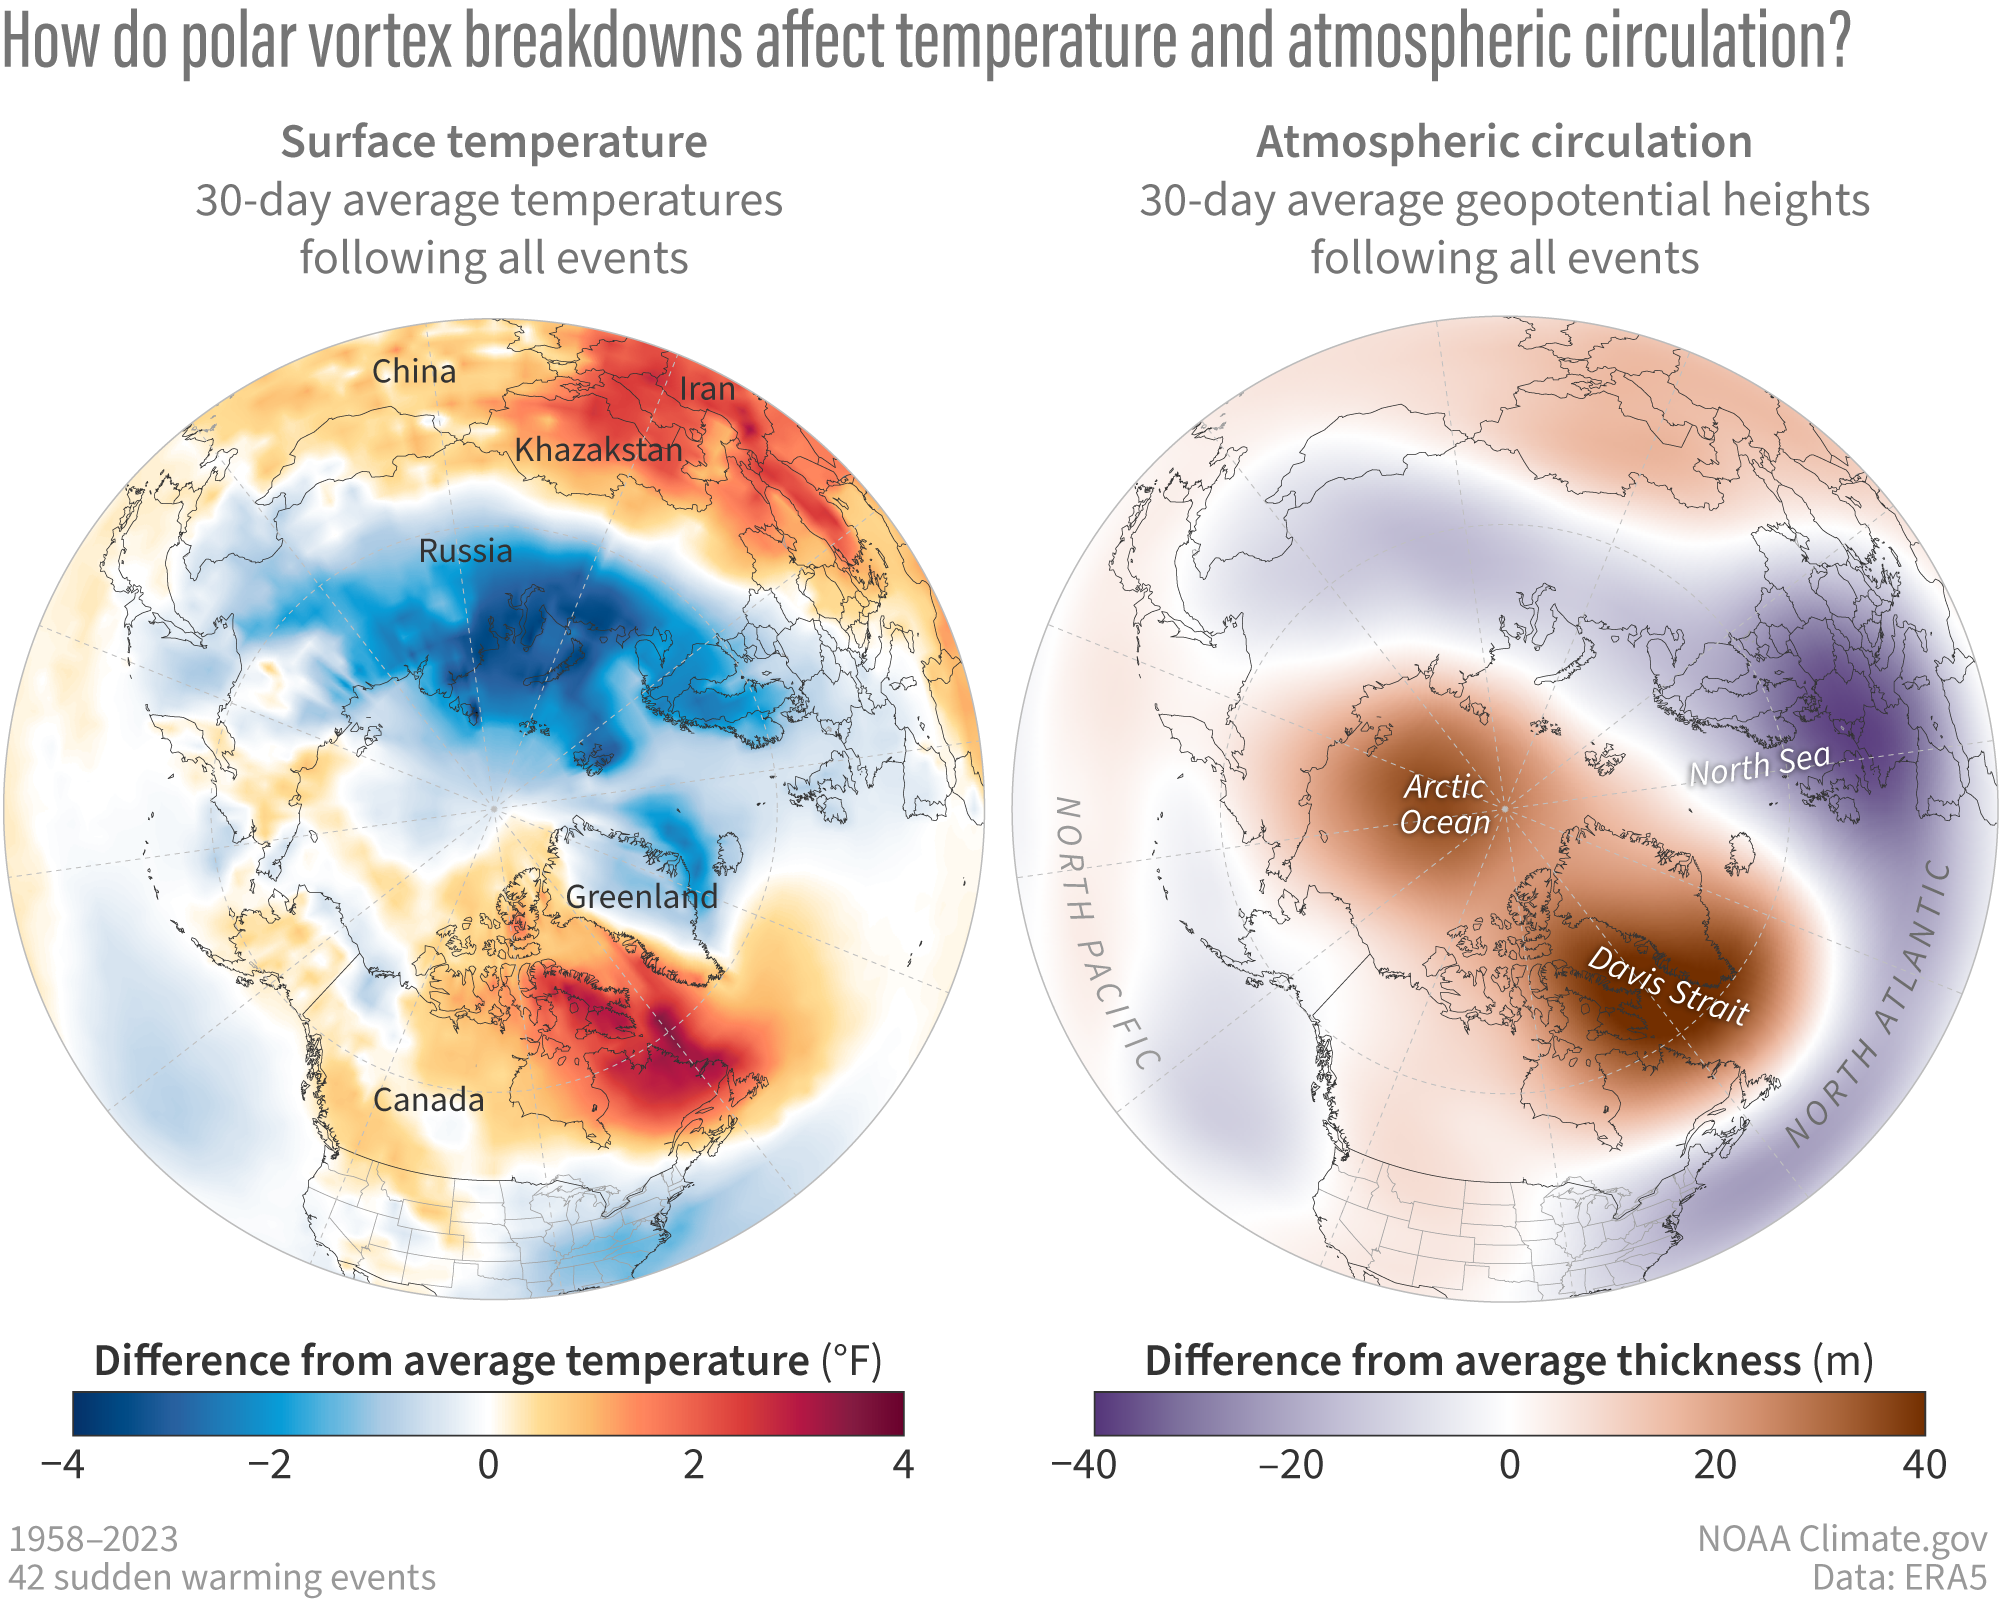
Average changes in (left) surface temperature and (right) atmospheric thickness (at the 500-hectoPascal pressure level) for the 30 days after the 42 observed major sudden stratospheric warmings from 1958-2023. NOAA Climate.gov image based on ERA5 reanalysis data provided by Amy Butler.