This website is an ARCHIVED version of NOAA Climate.gov as of June 25, 2025. Content is not being updated or maintained, and some links may no longer work.
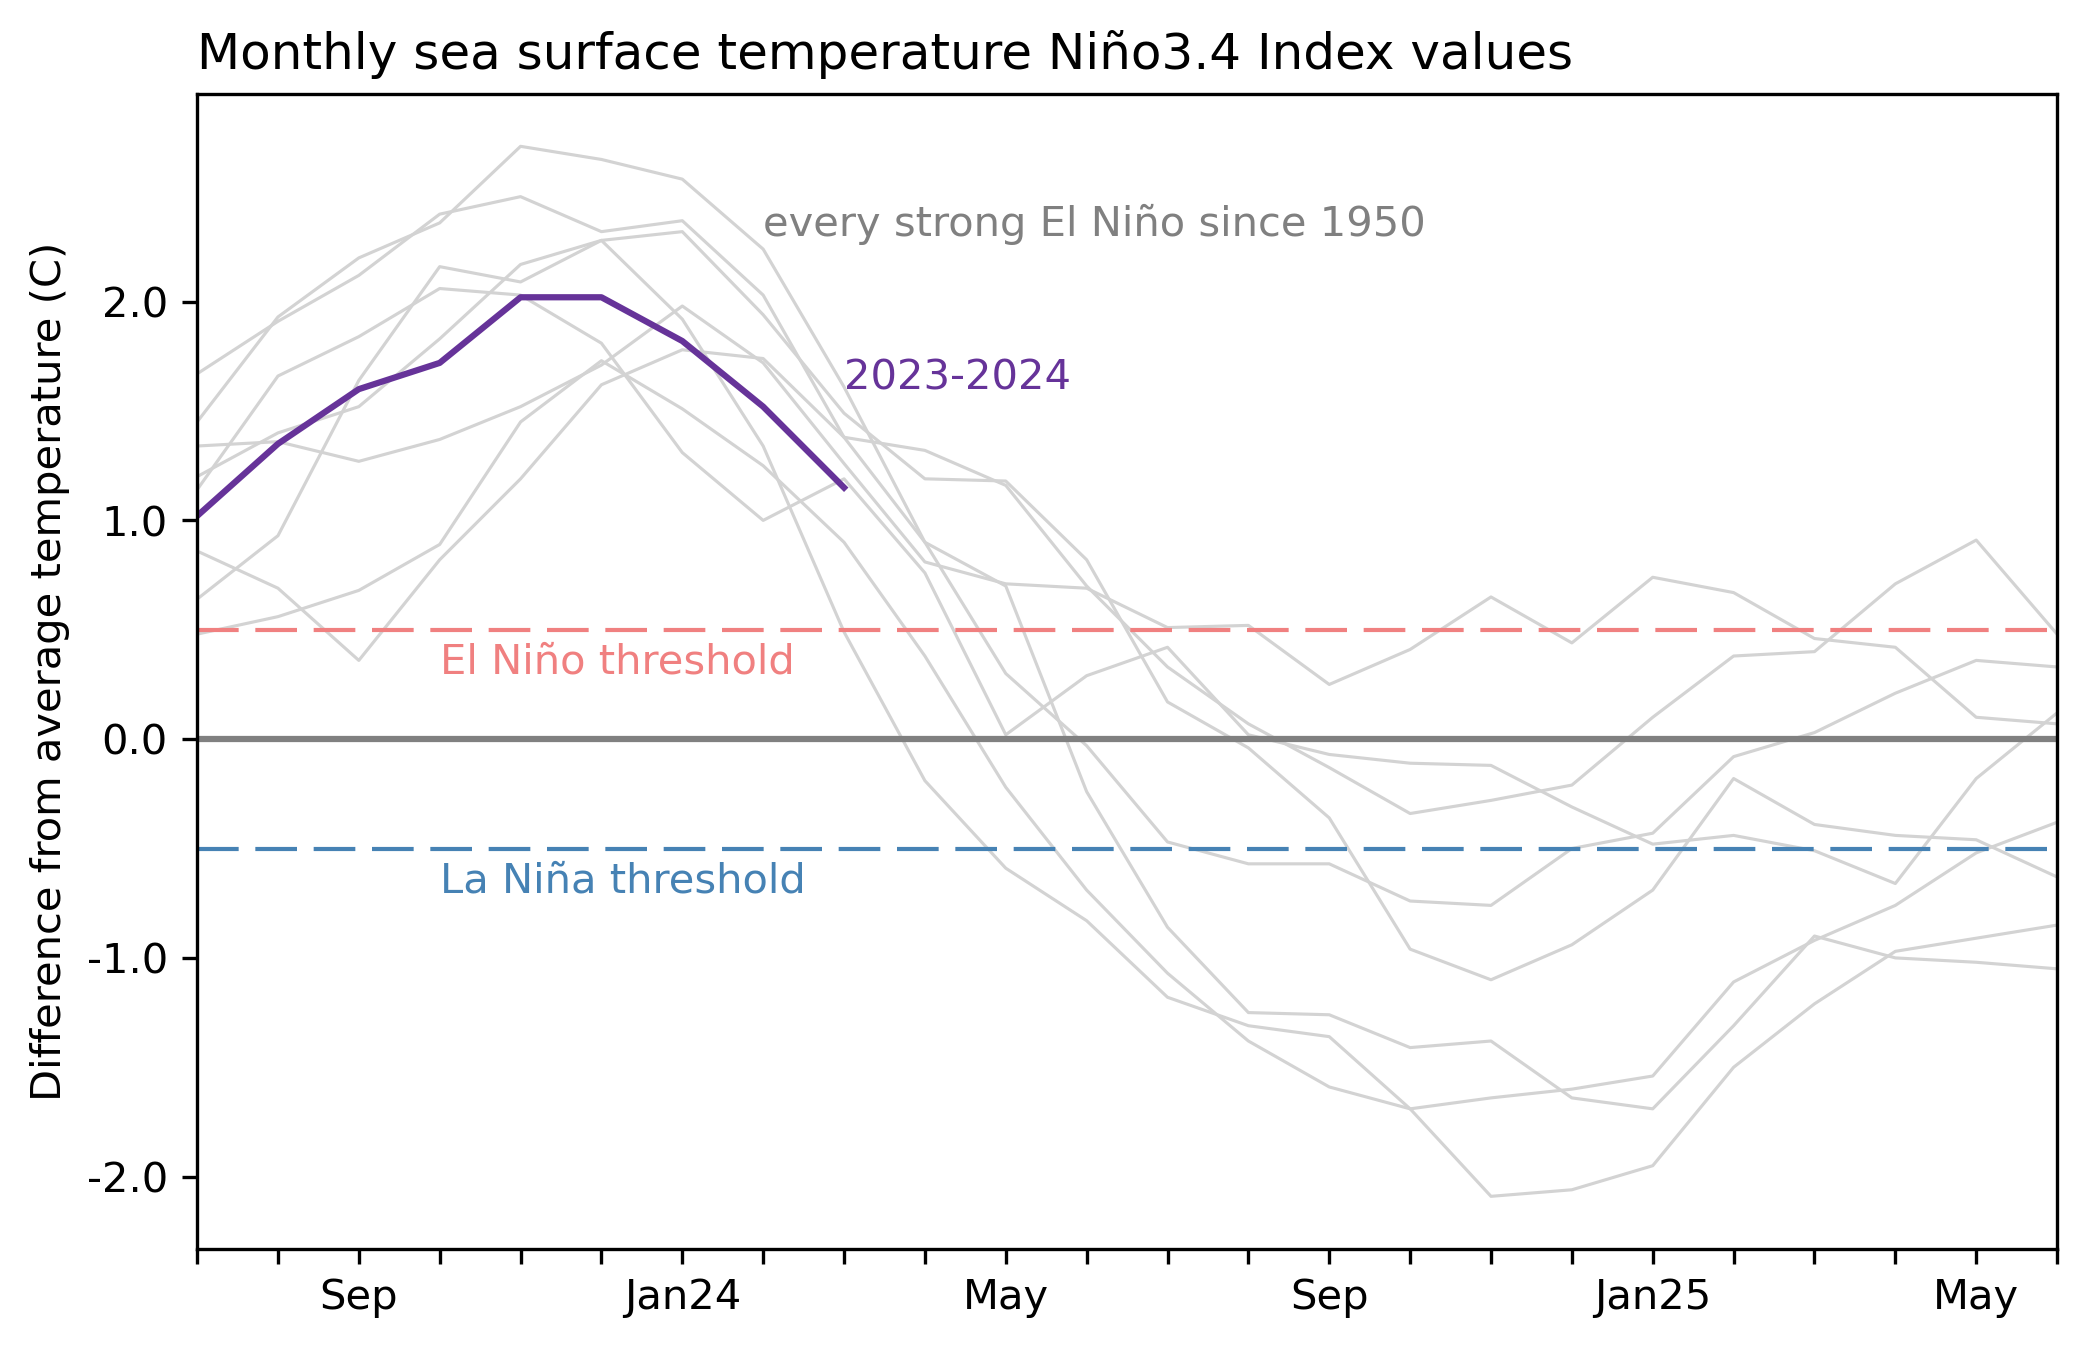
2-year history of sea surface temperatures in the Niño-3.4 region of the tropical Pacific for all strong El Niño events since 1950 (gray lines) and the current event (purple line). Graph by Emily Becker based on monthly Niño-3.4 index data from CPC using ERSSTv5.
