Image caption
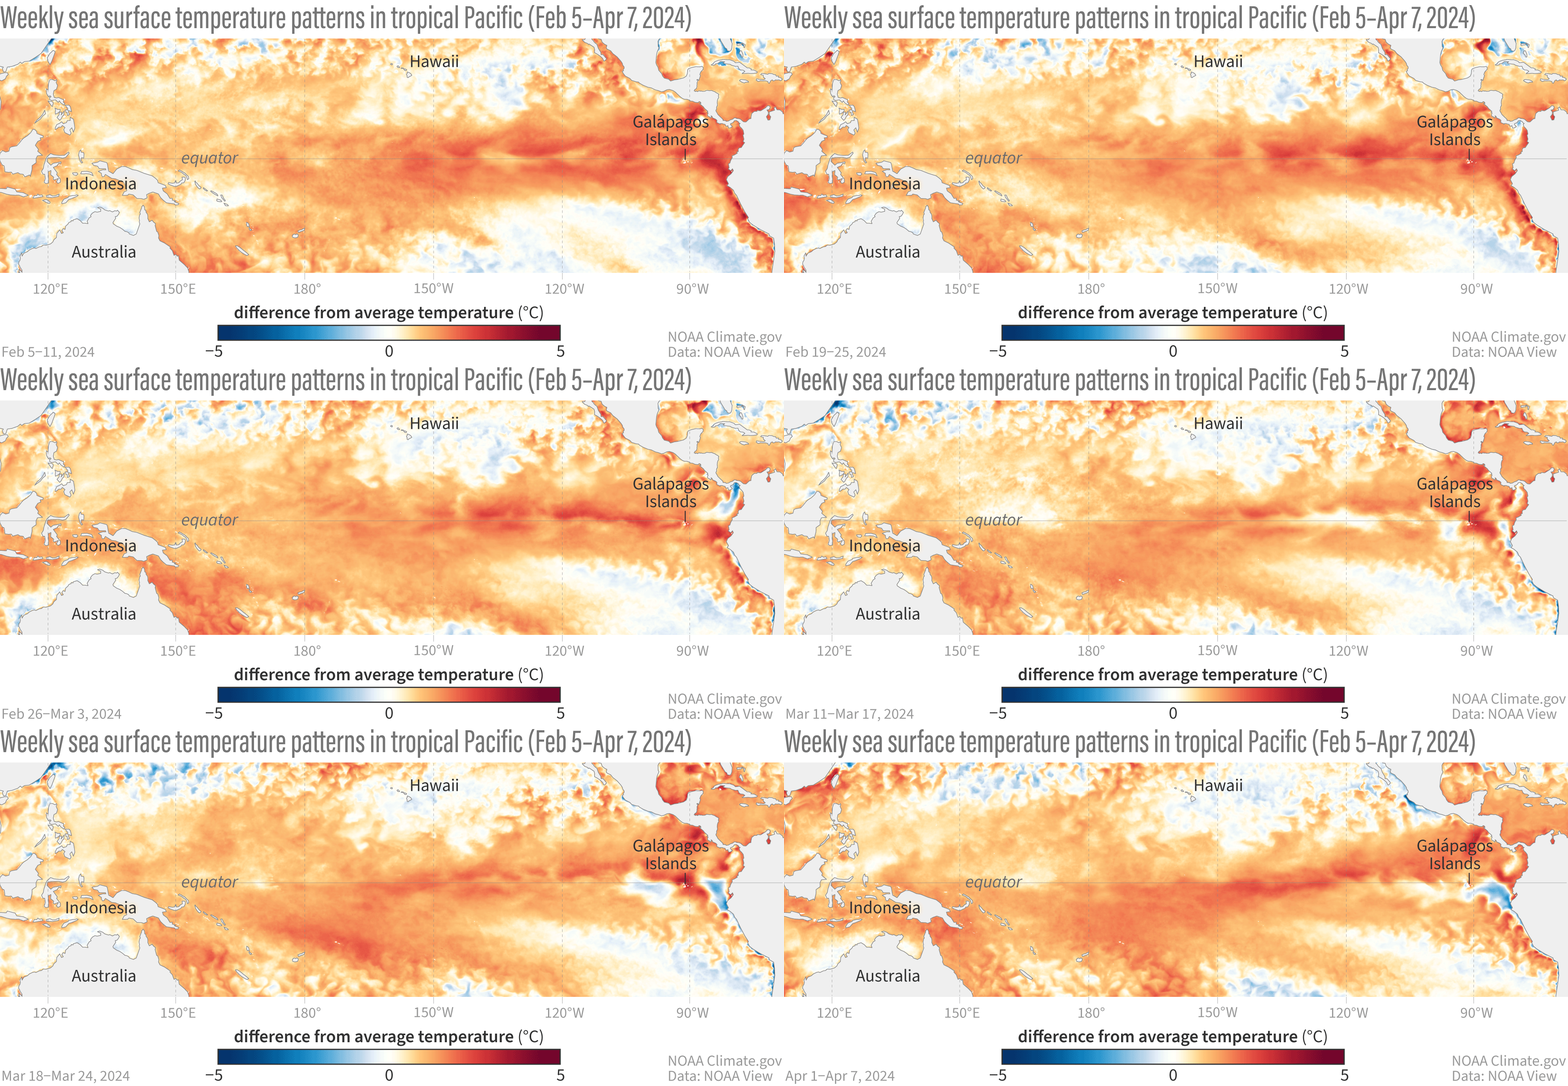
Animation of maps of sea surface temperatures in the Pacific Ocean compared to the long-term average over five-day periods from February through early April 2024. El Niño’s warm surface is weakening and some regions of cooler-than-average sea surface temperature are appearing. NOAA Climate.gov, based on Coral Reef Watch maps available from NOAA View.