
Image caption
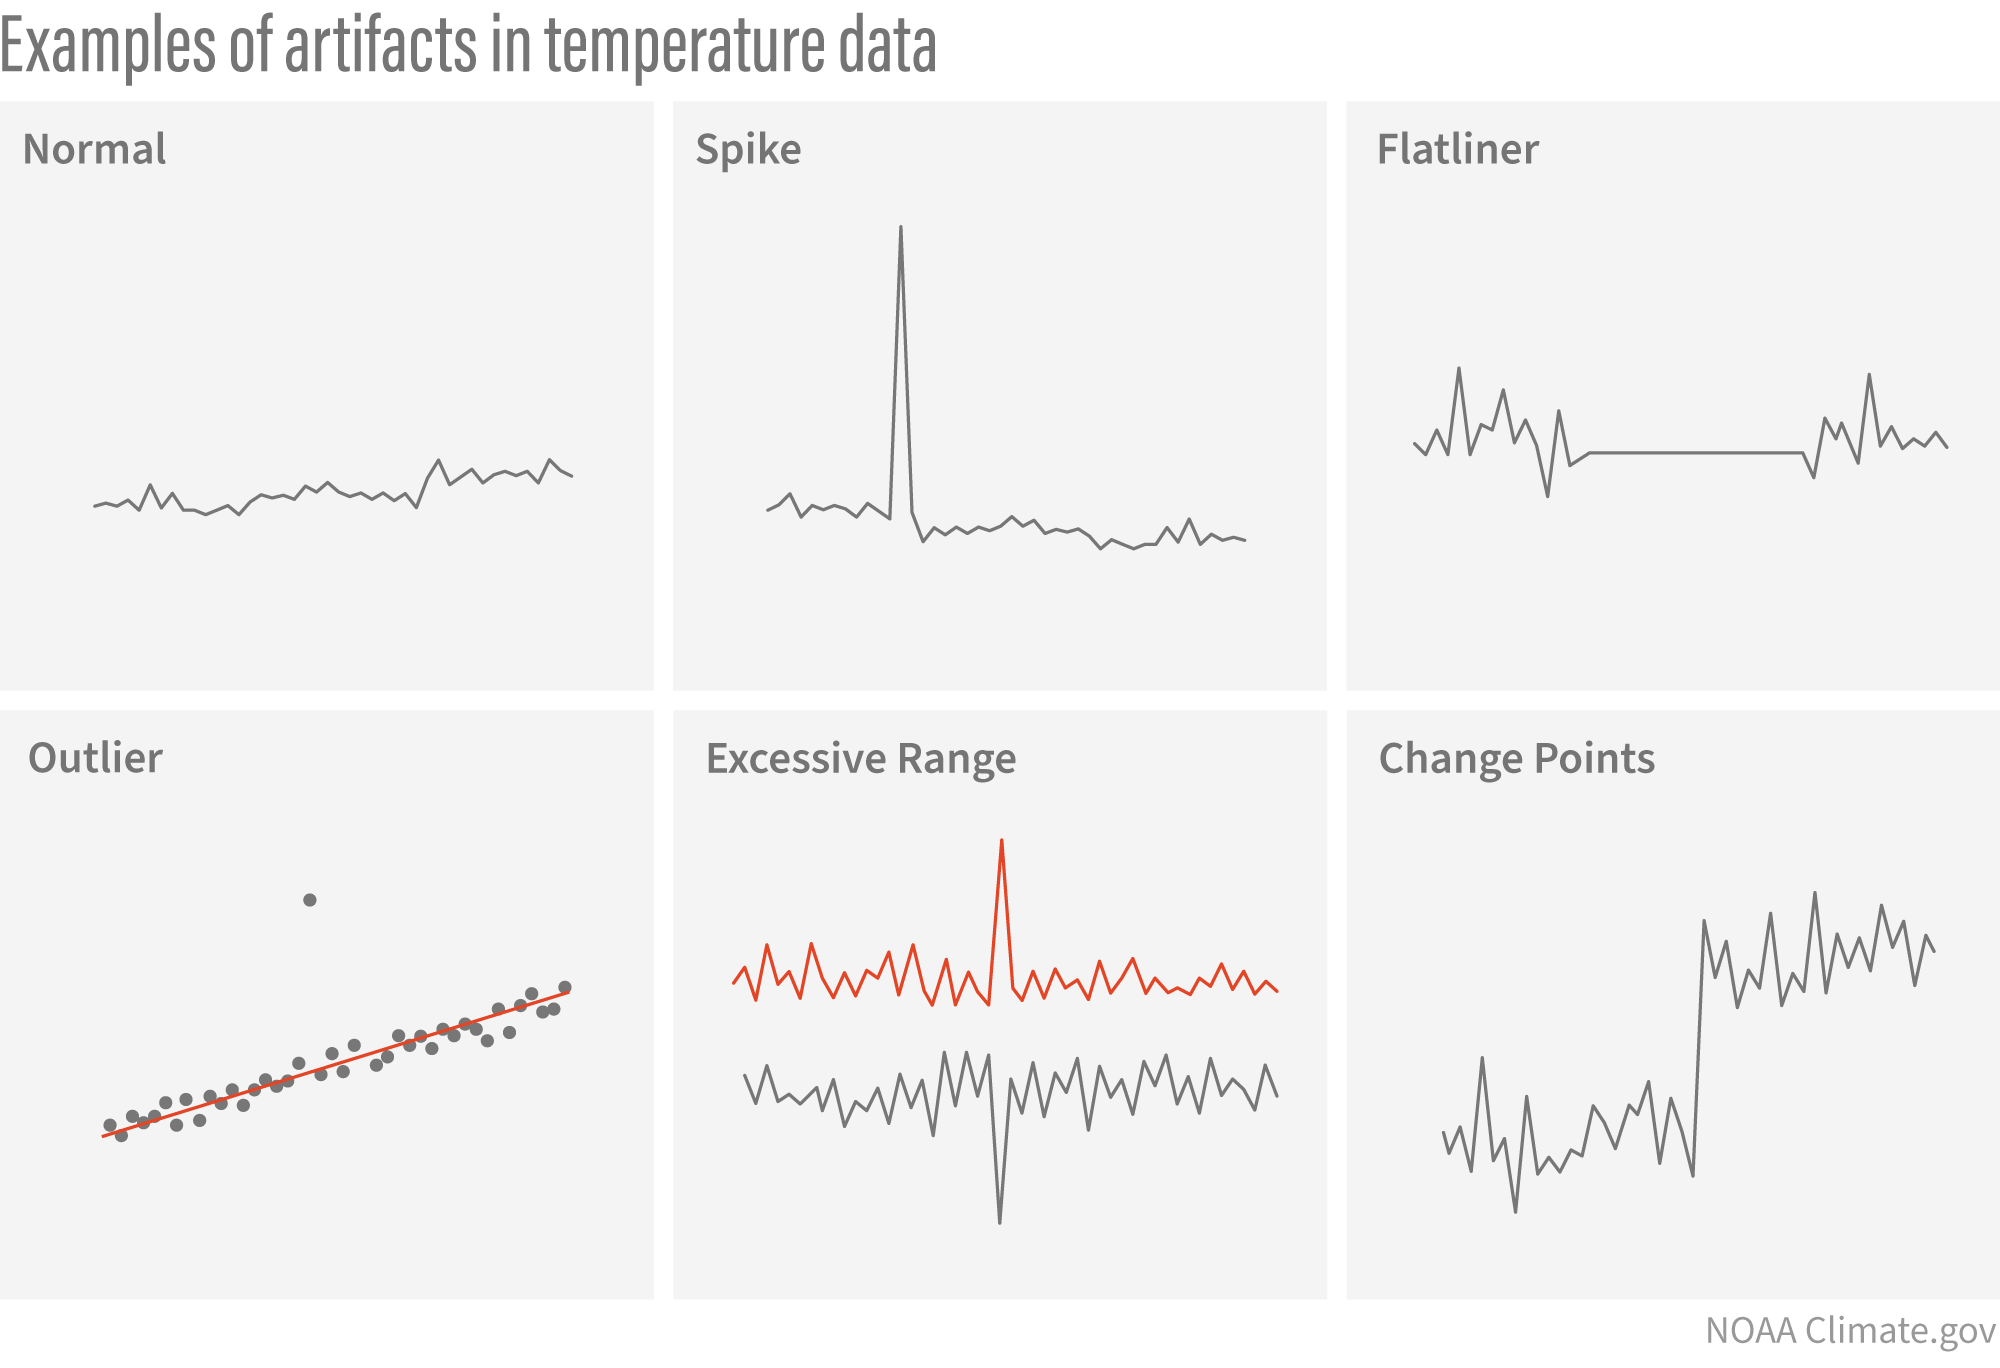
The top left graph shows a common pattern of mid-morning temperatures measured every 5 minutes. The remaining panels show data patterns that may indicate a disturbance or a problem with the instruments. Data records that show these types of artifacts are flagged and excluded from further processing when calculating climate.