
Image caption
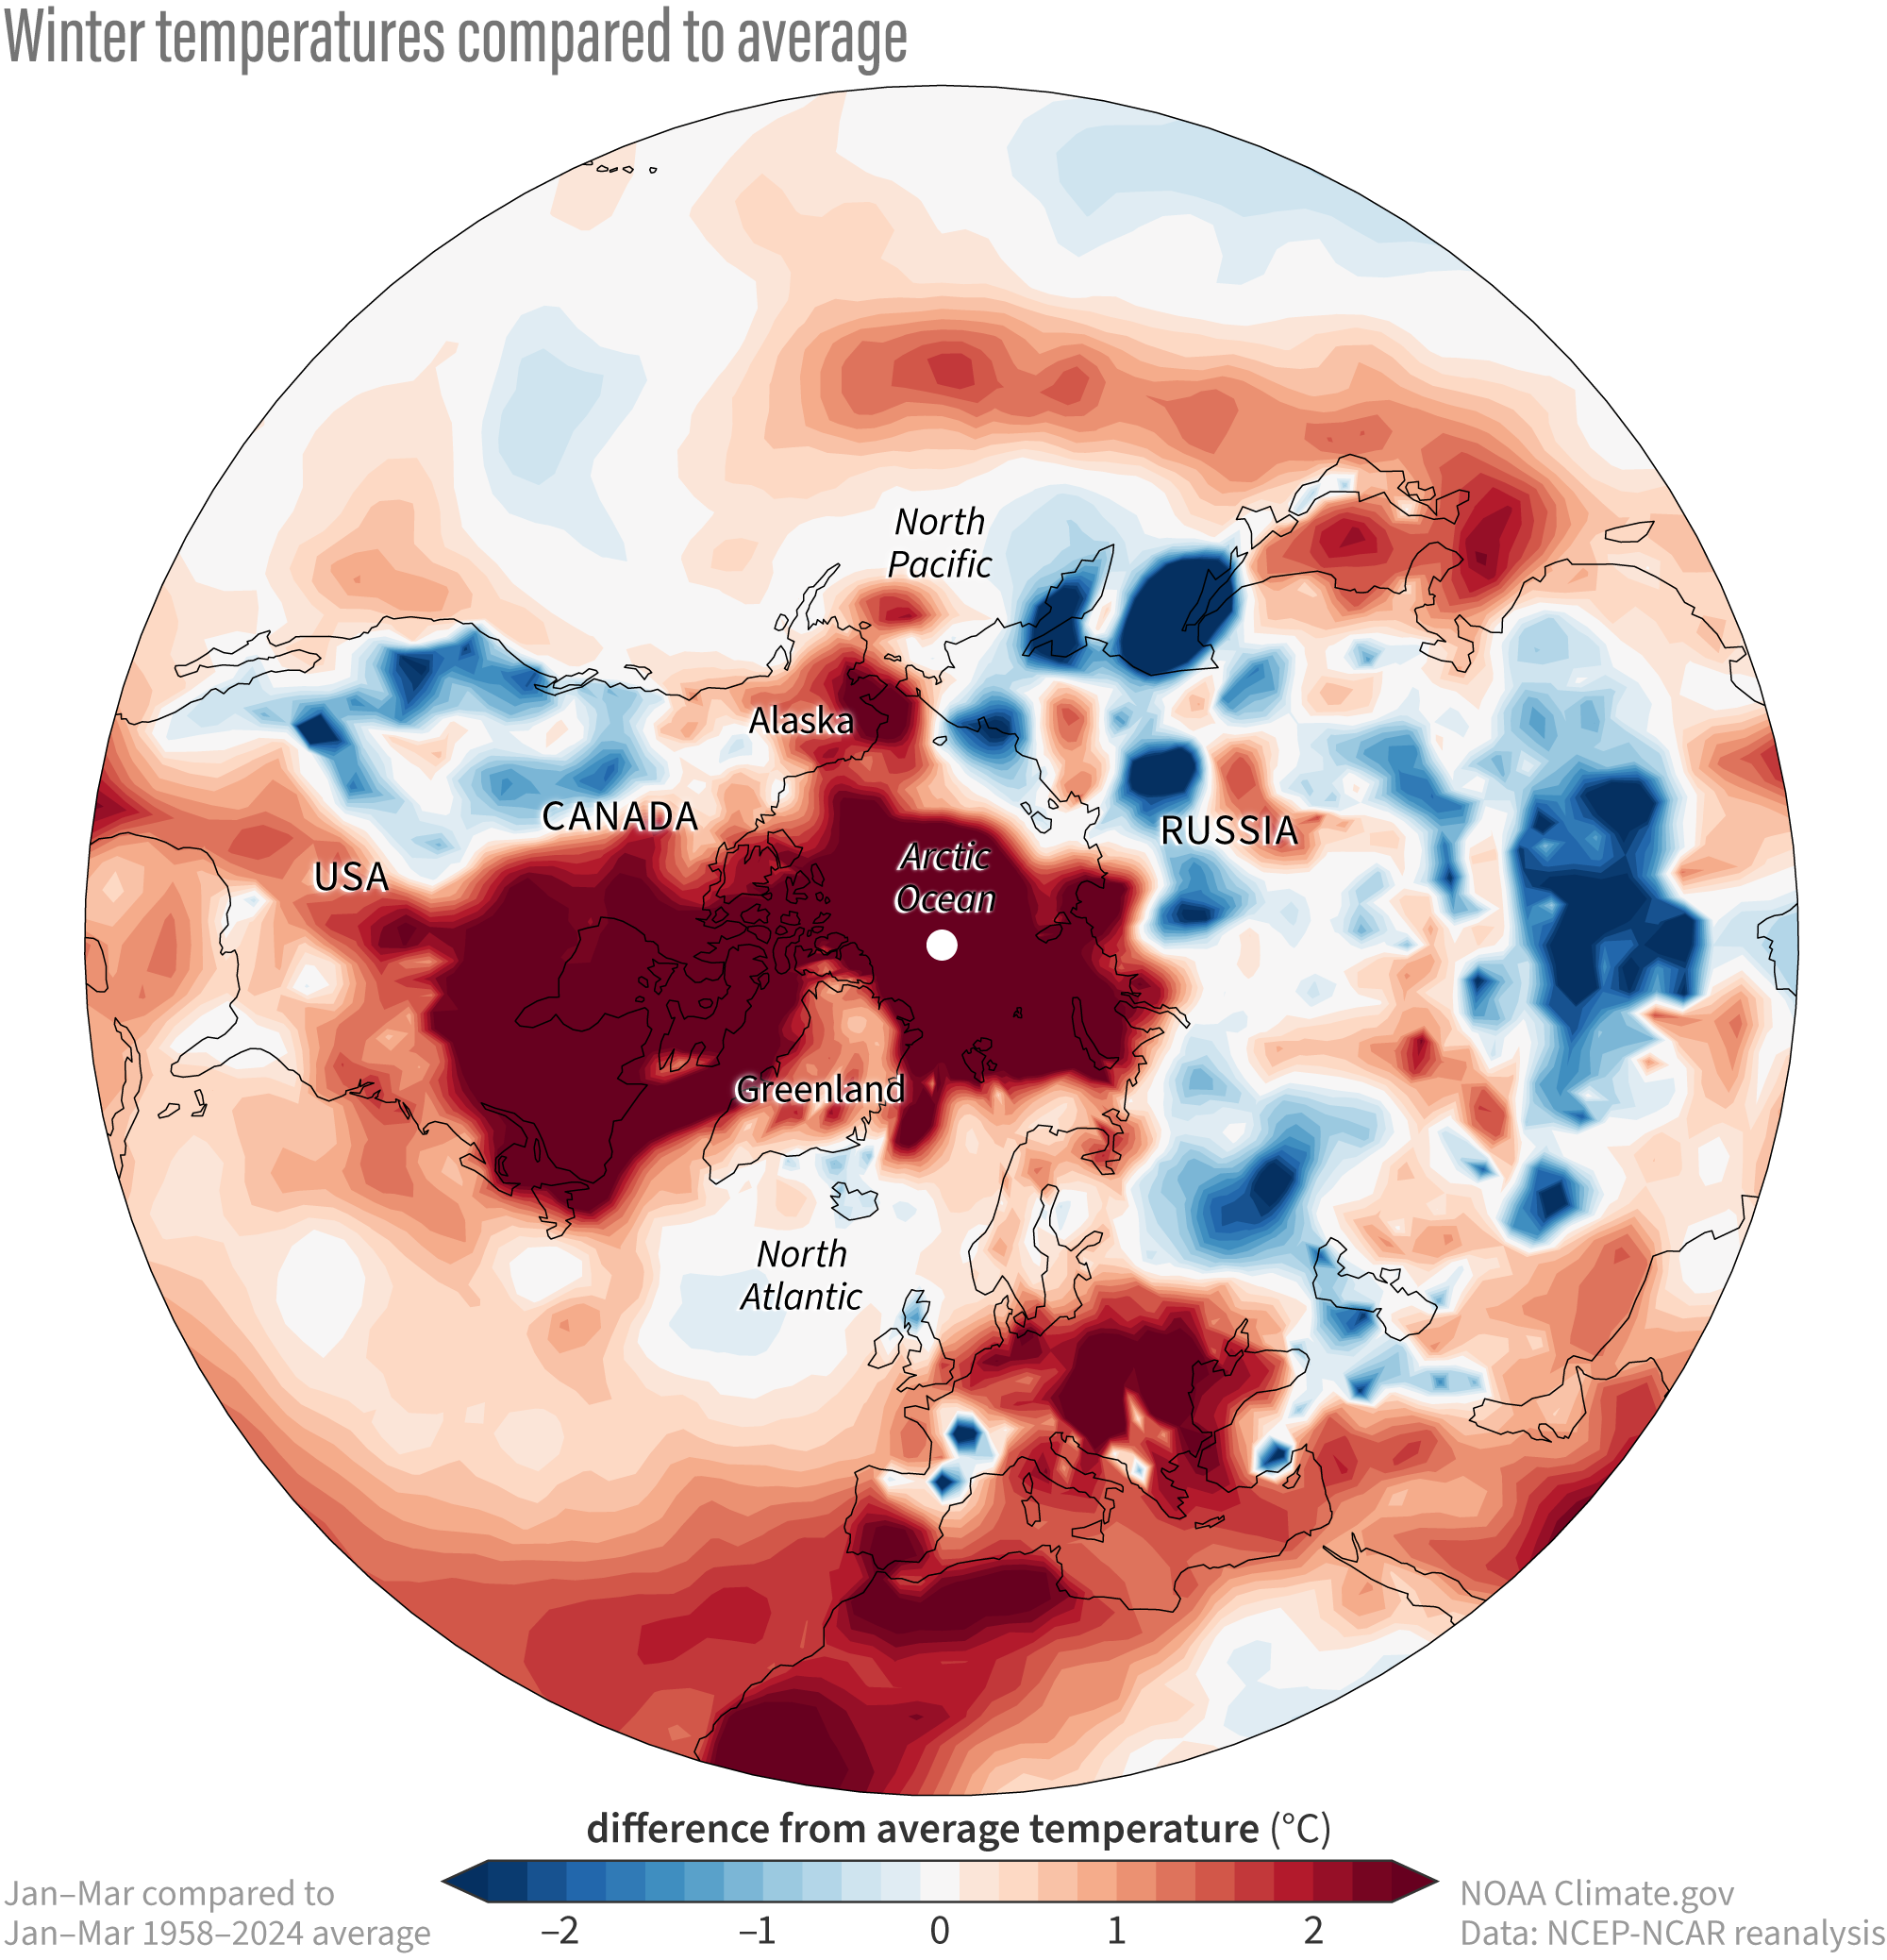
January-February-March temperatures compared to the 1958-2024 average across the Northern Hemisphere. NOAA Climate.gov image, adapted from original by Amy Butler.
January-February-March temperatures compared to the 1958-2024 average across the Northern Hemisphere. NOAA Climate.gov image, adapted from original by Amy Butler.