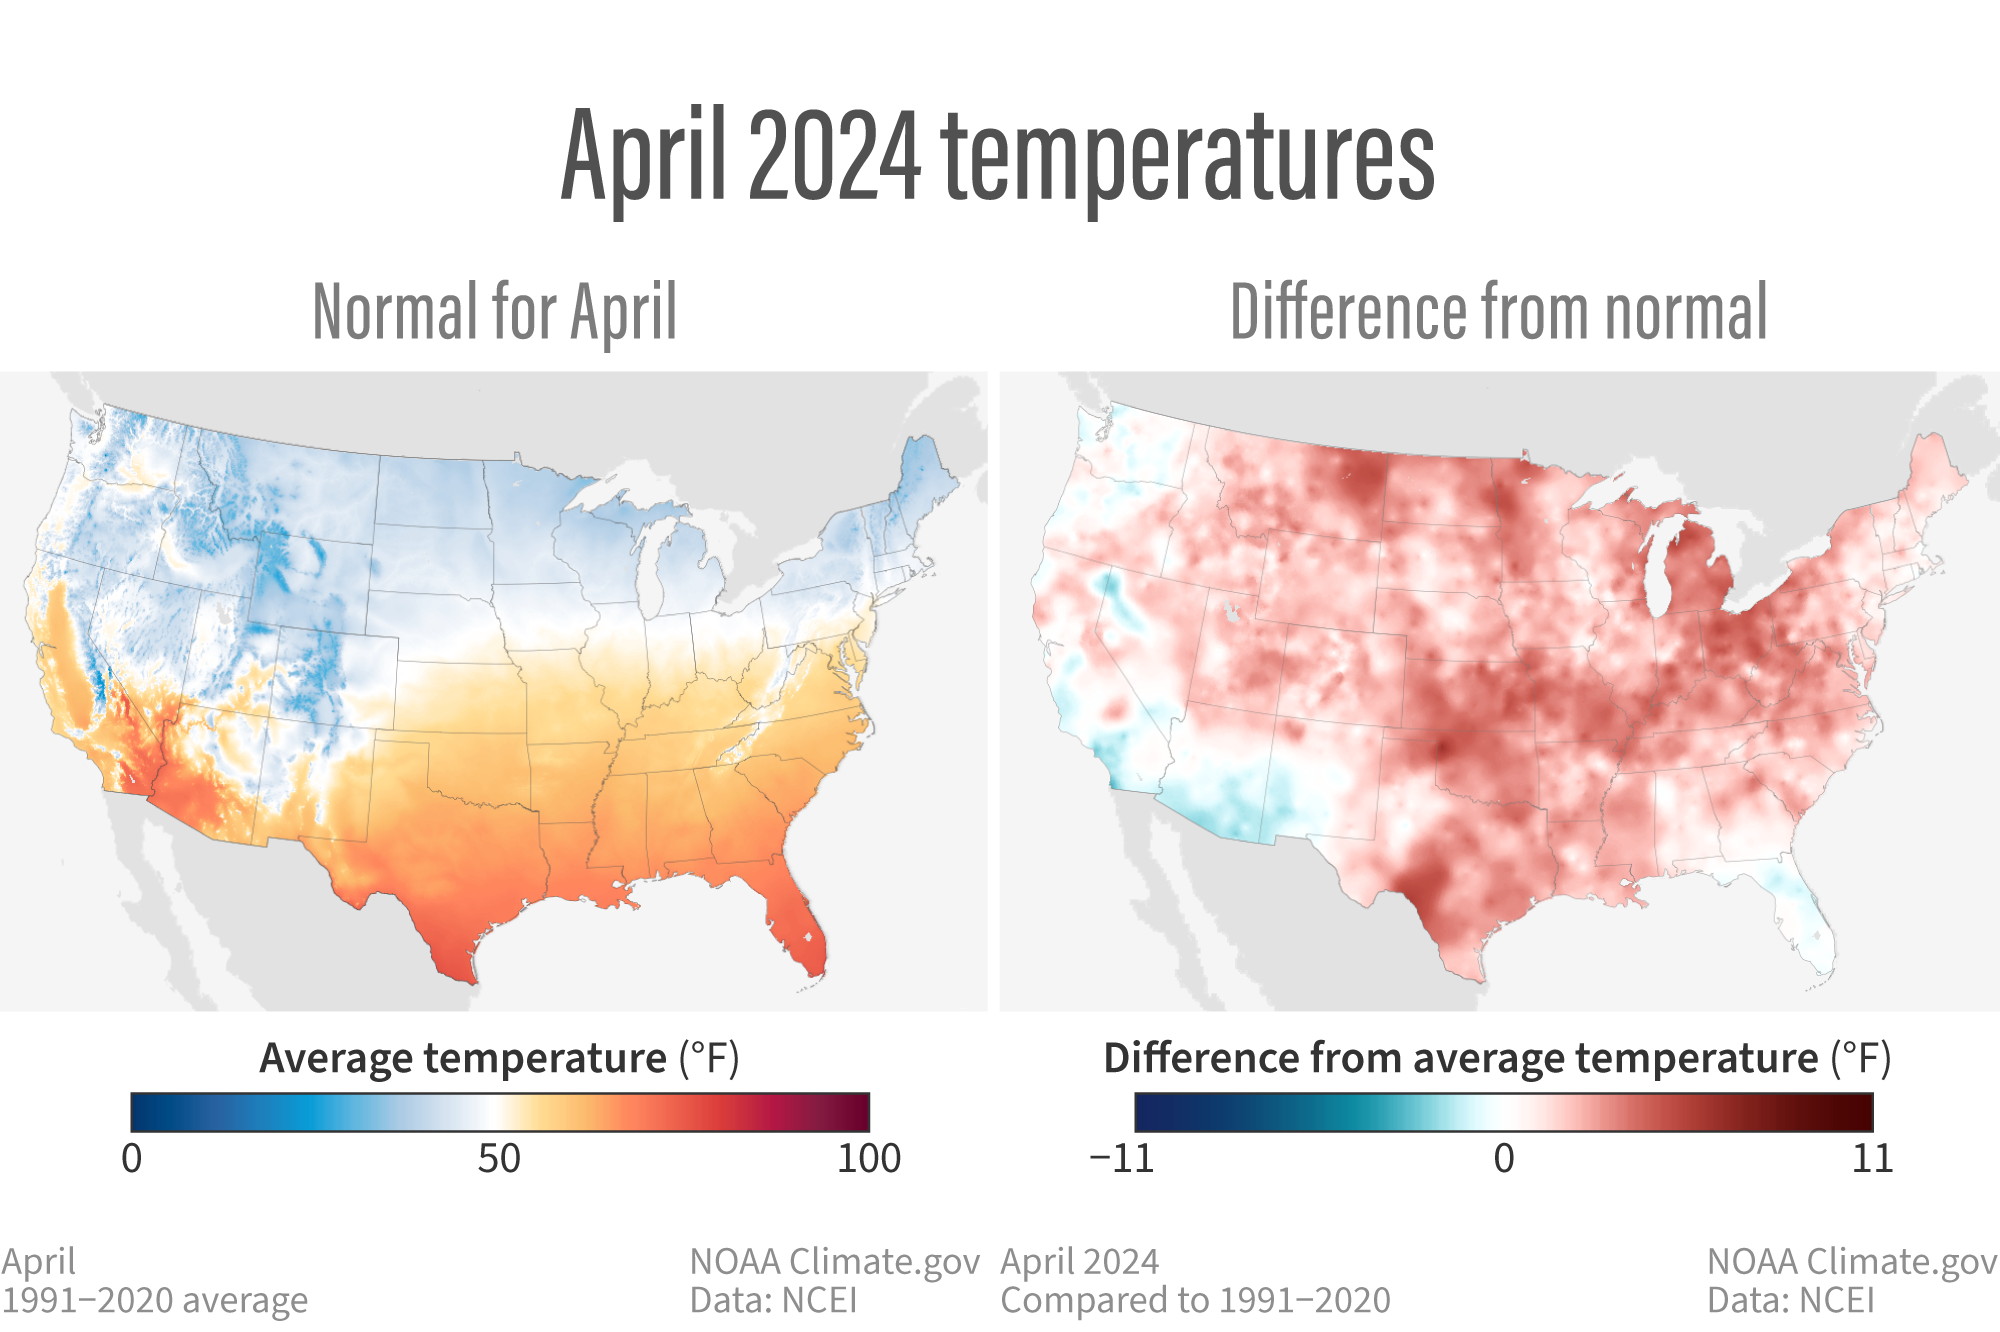
Image caption
(left) Normal April temperatures across the contiguous United States based on data from 1991-2020. Places where average temperature is below 50 degrees Fahrenheit are colored in shades of blue. Places where it's above 50 degrees are colored in yellow to red. (right) Temperatures in April 2024 compared to the 1991-2020 average. Blue indicates a cooler-than-average April; red means a warmer-than-average April. NOAA Climate.gov maps from our Data Snapshots collection, based on data from NOAA National Centers for Environmental Information.