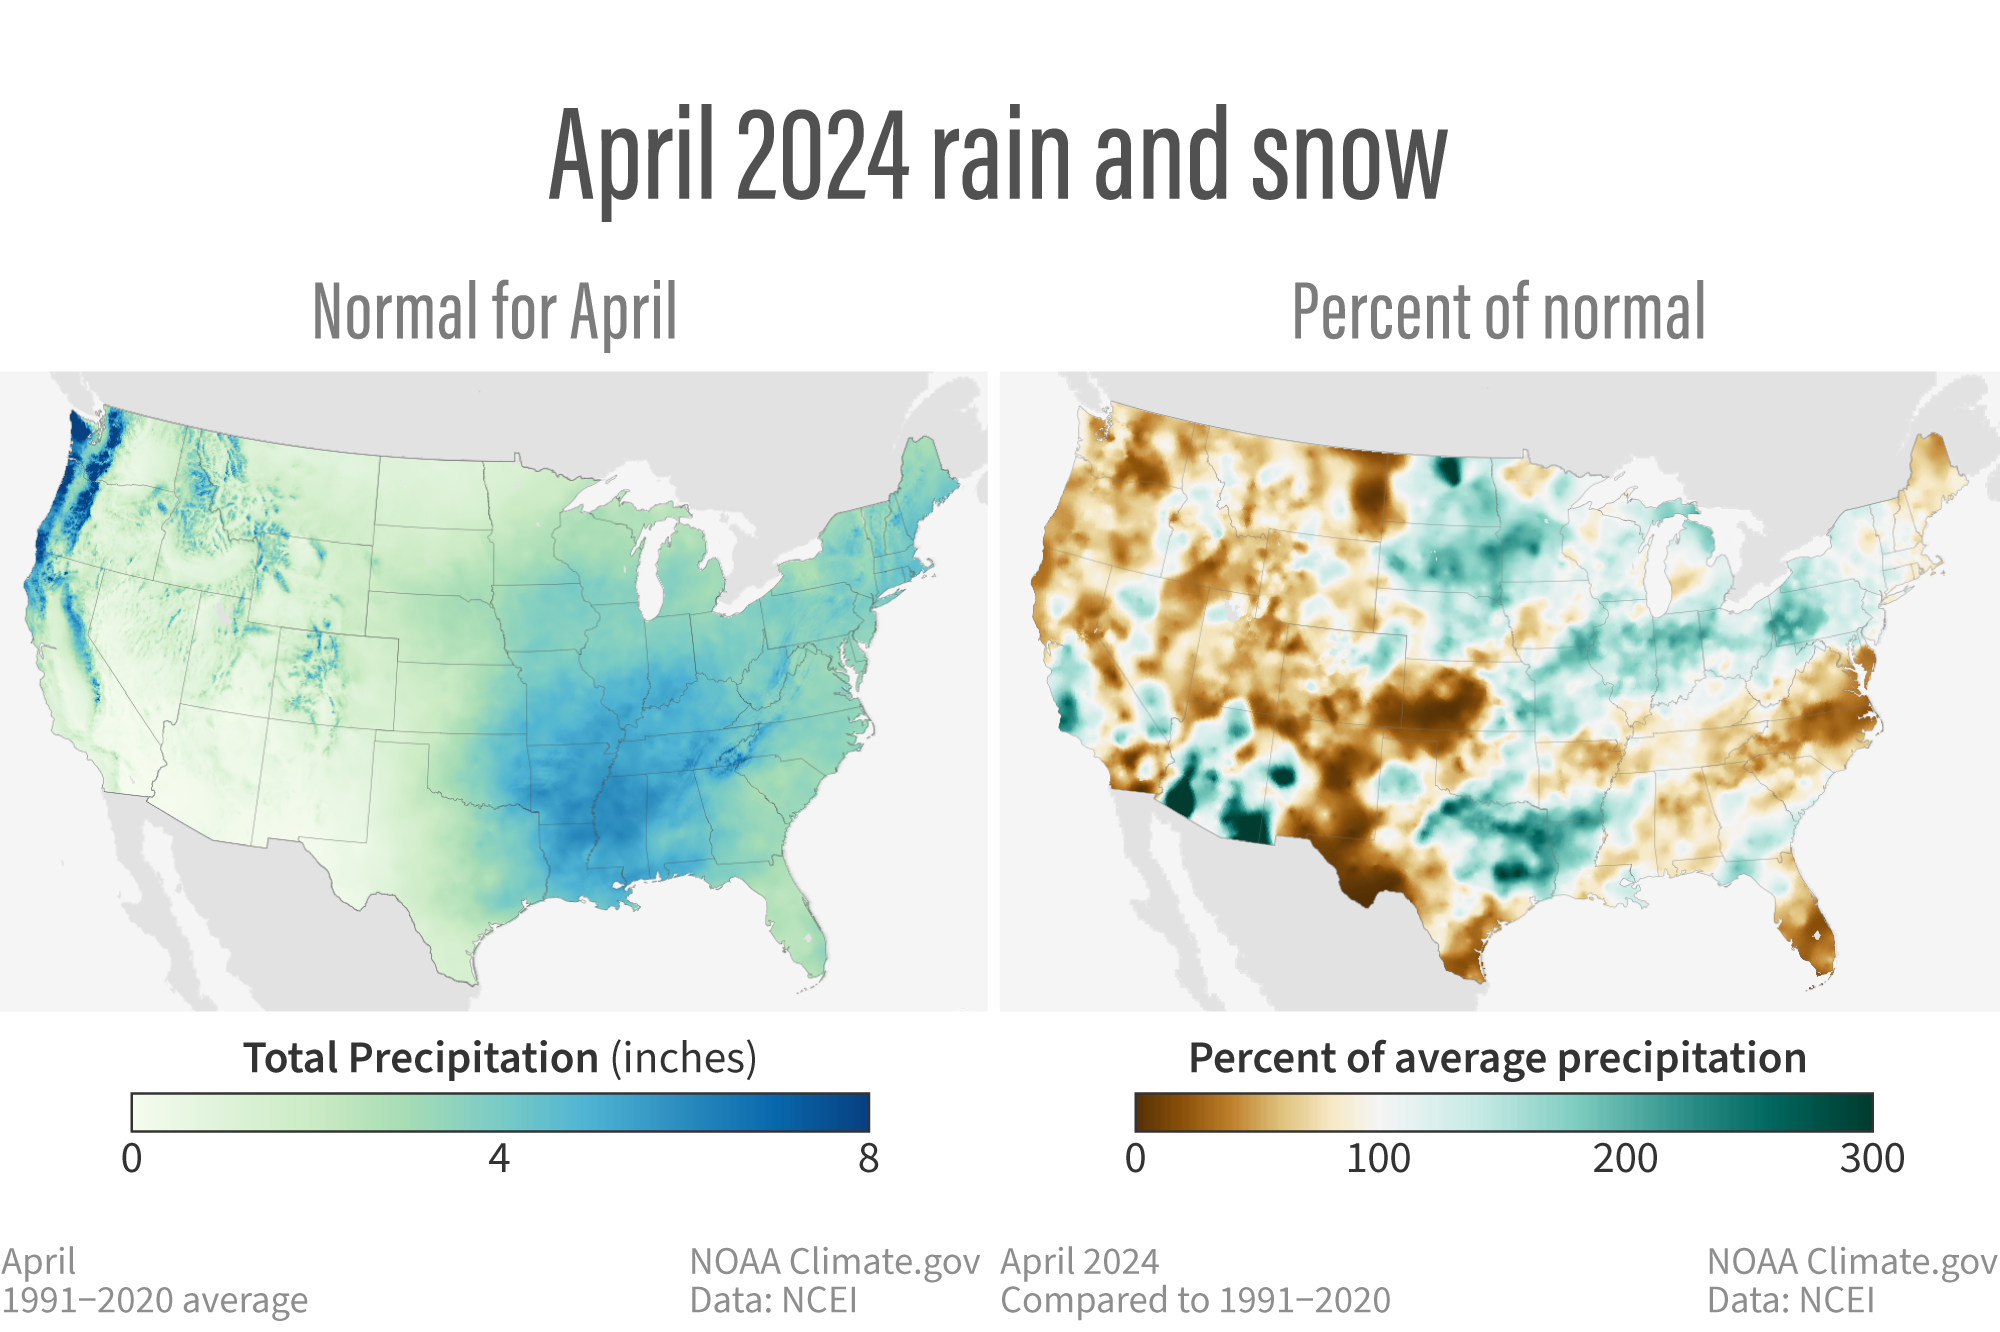
Image caption
(left) Normal April precipitation (rain and snow combined) across the contiguous United States based on data from 1991-2020. Places where average precipitation is below 4 inches are colored in shades of light green; places where April average precipitation is above 4 inches are colored shades of blue. (right) Precipitation in April 2024 as a percent of the 1991-2020 average for the month. Blue-green indicates a wetter-than-average April; brown means a drier-than-average April. NOAA Climate.gov maps from our Data Snapshots collection, based on data from NOAA National Centers for Environmental Information.