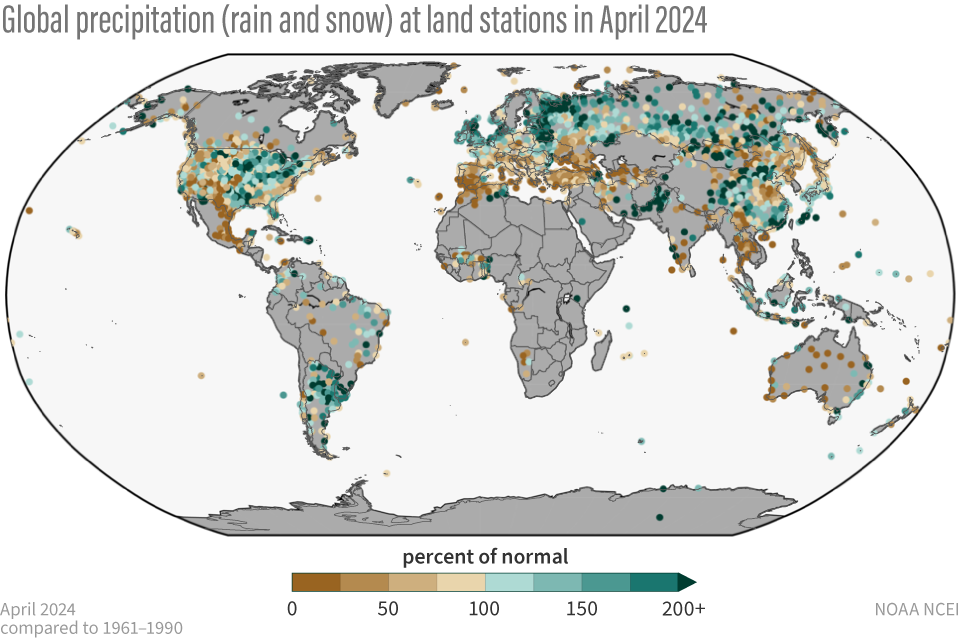
Image caption
Percent of normal precipitation for global land based stations in April 2024 compared to a base line of 1961 to 1990. Places that received more precipitation than average are colored green; places that received less precipitation than average are colored brown. Gray areas represent missing data. Image by NOAA Climate.gov, based on data from NOAA National Centers for Environmental Information.