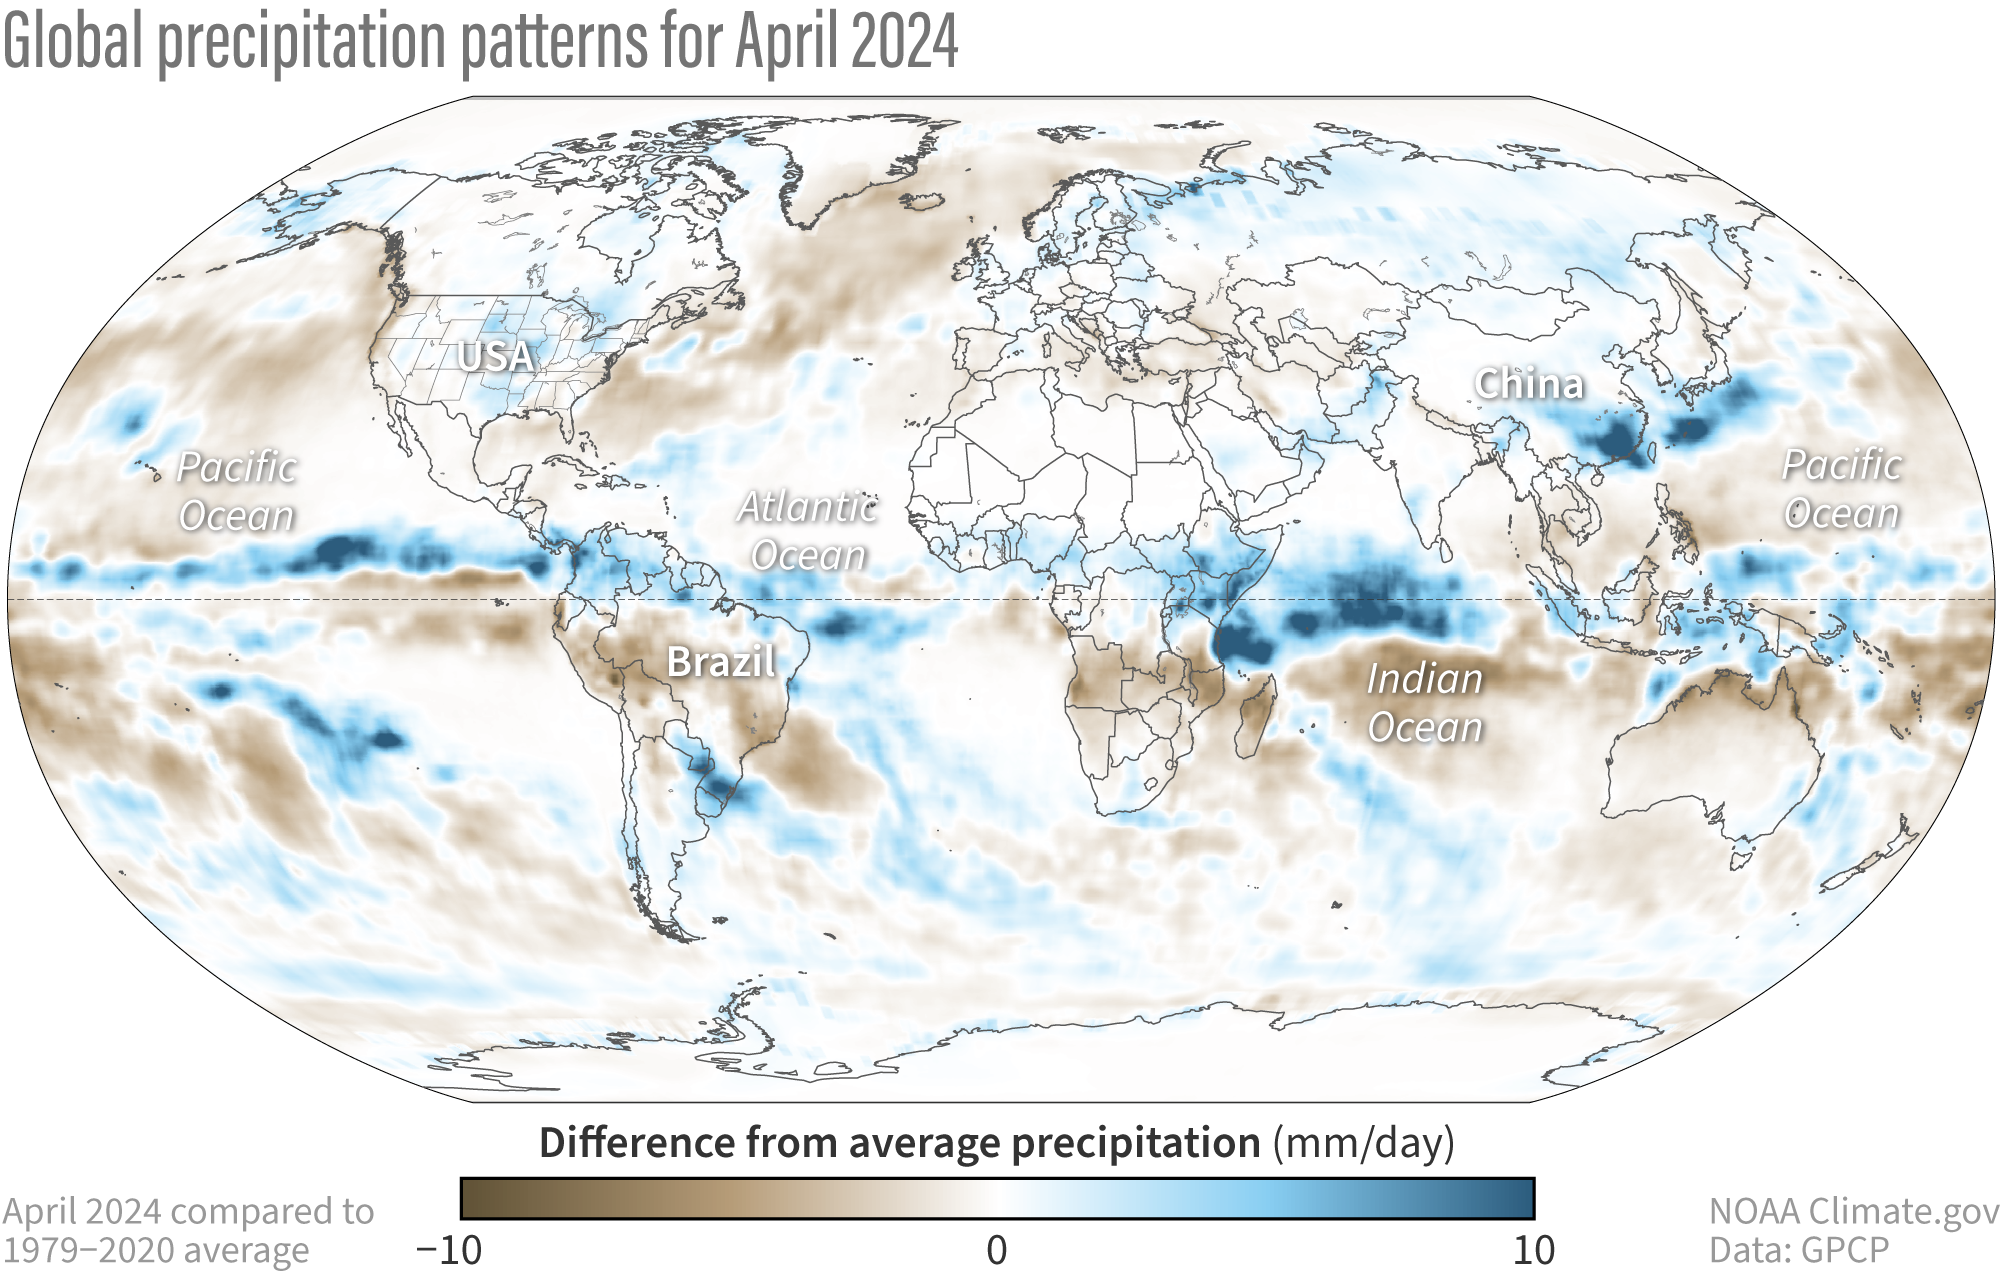
Image caption
Difference from average precipitation around the world in April 2024 compared to the 1979-2020 average. Places that received more precipitation than average are colored blue; places that received less precipitation than average are colored brown. Map by NOAA Climate.gov, based on data provided by the Global Precipitation Climatology Project (University of Maryland).