
Image caption
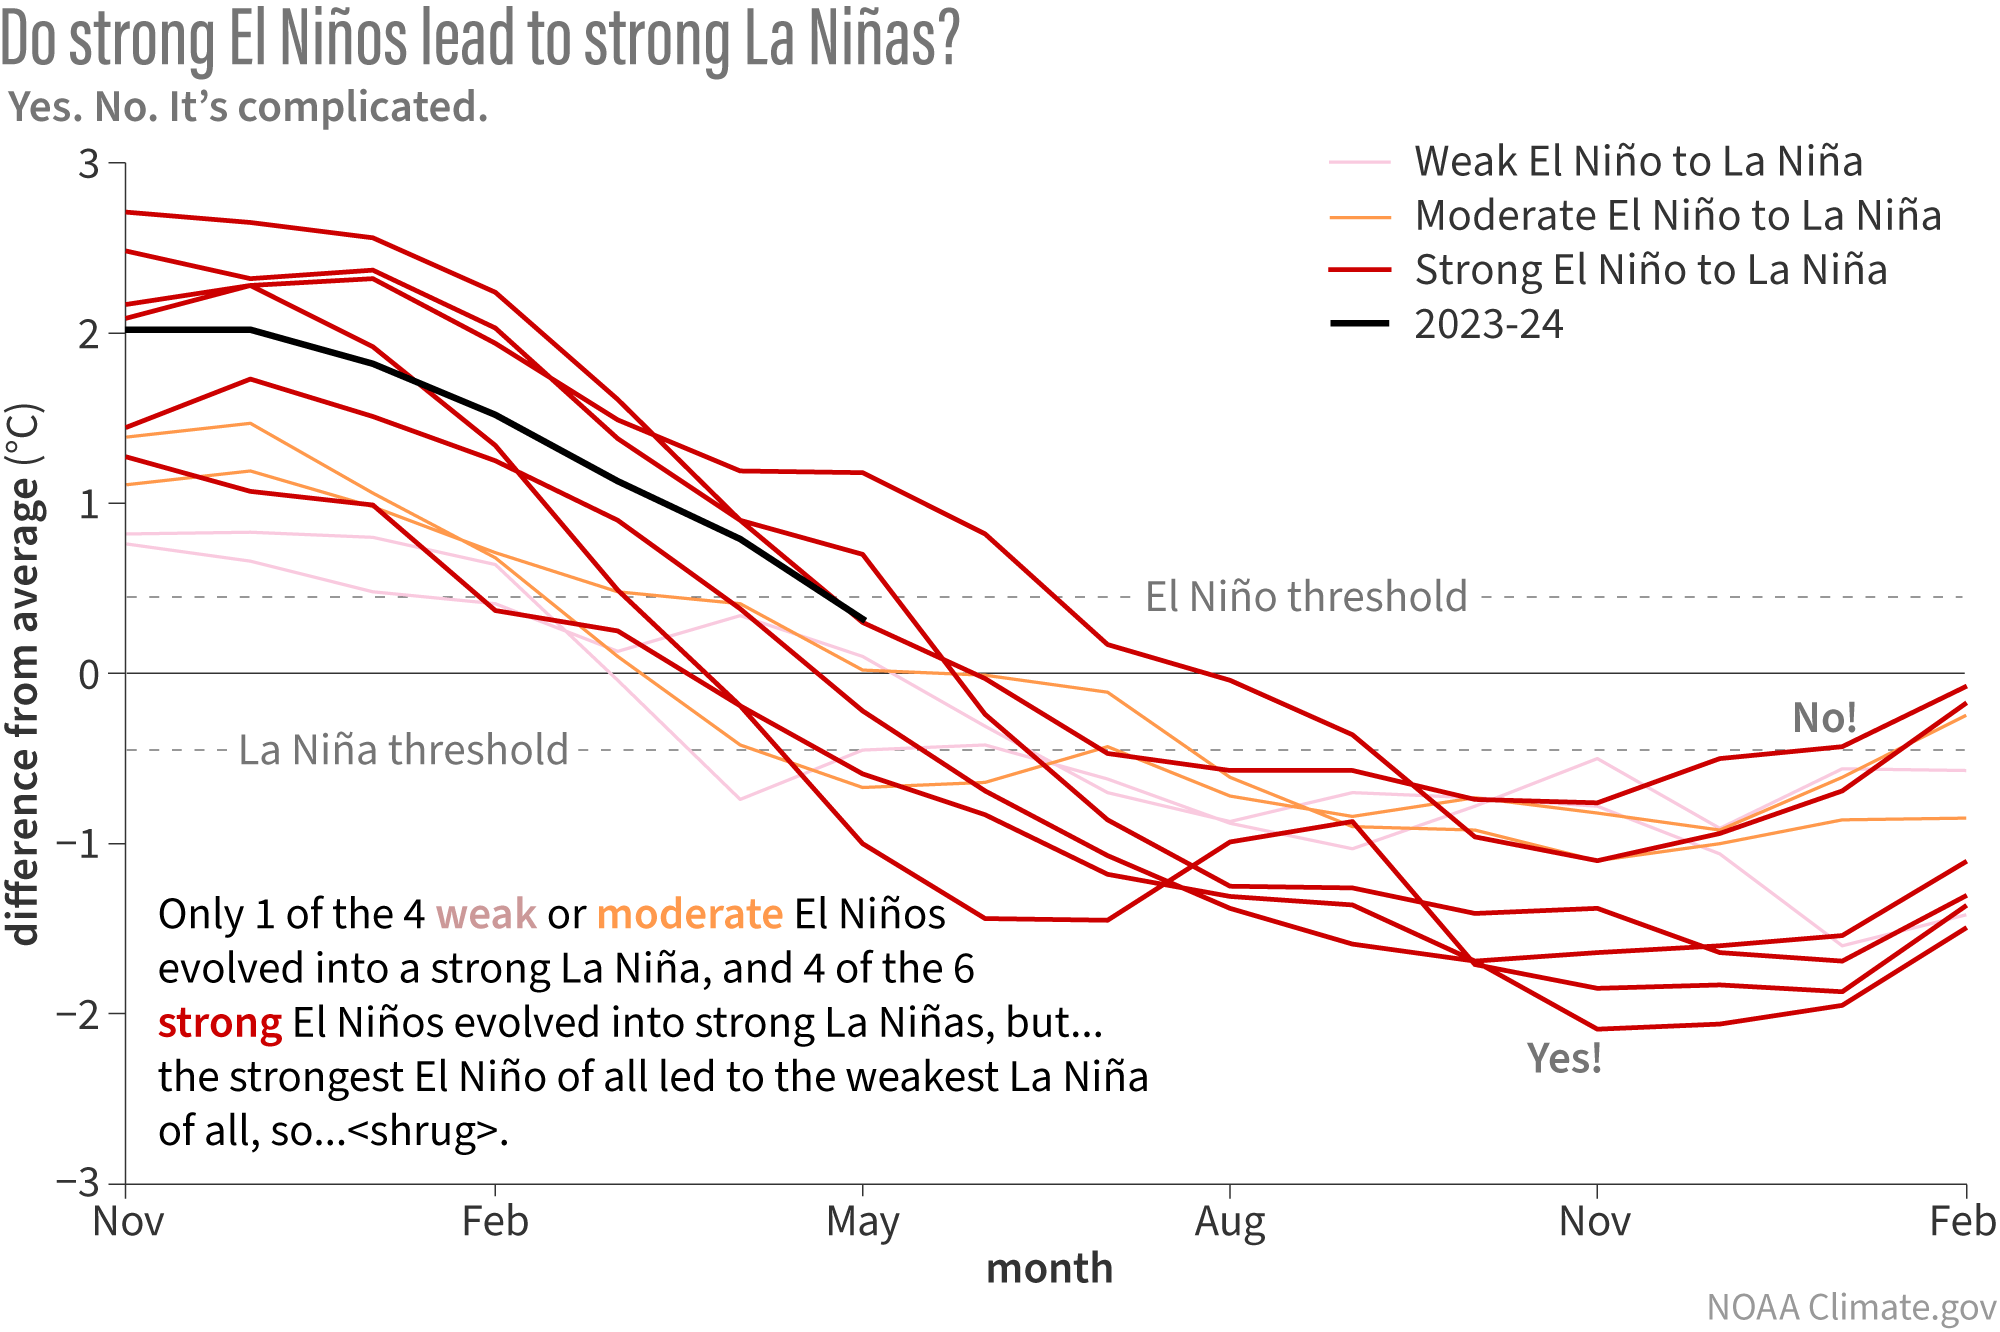
Since 1950, there have been 10 cases in which the ENSO climate pattern flipped from El Niño to La Niña with no neutral winter in between. Each line on this graph shows the evolution of sea surface temperature anomalies in the Niño-3.4 region of the tropical Pacific (the key ENSO-monitoring region) through the switch. Many, but not all, of the strongest El Niños (red lines) evolved into strong La Niñas. NOAA Climate.gov image, based on analysis by Michelle L'Heureux.