
Image caption
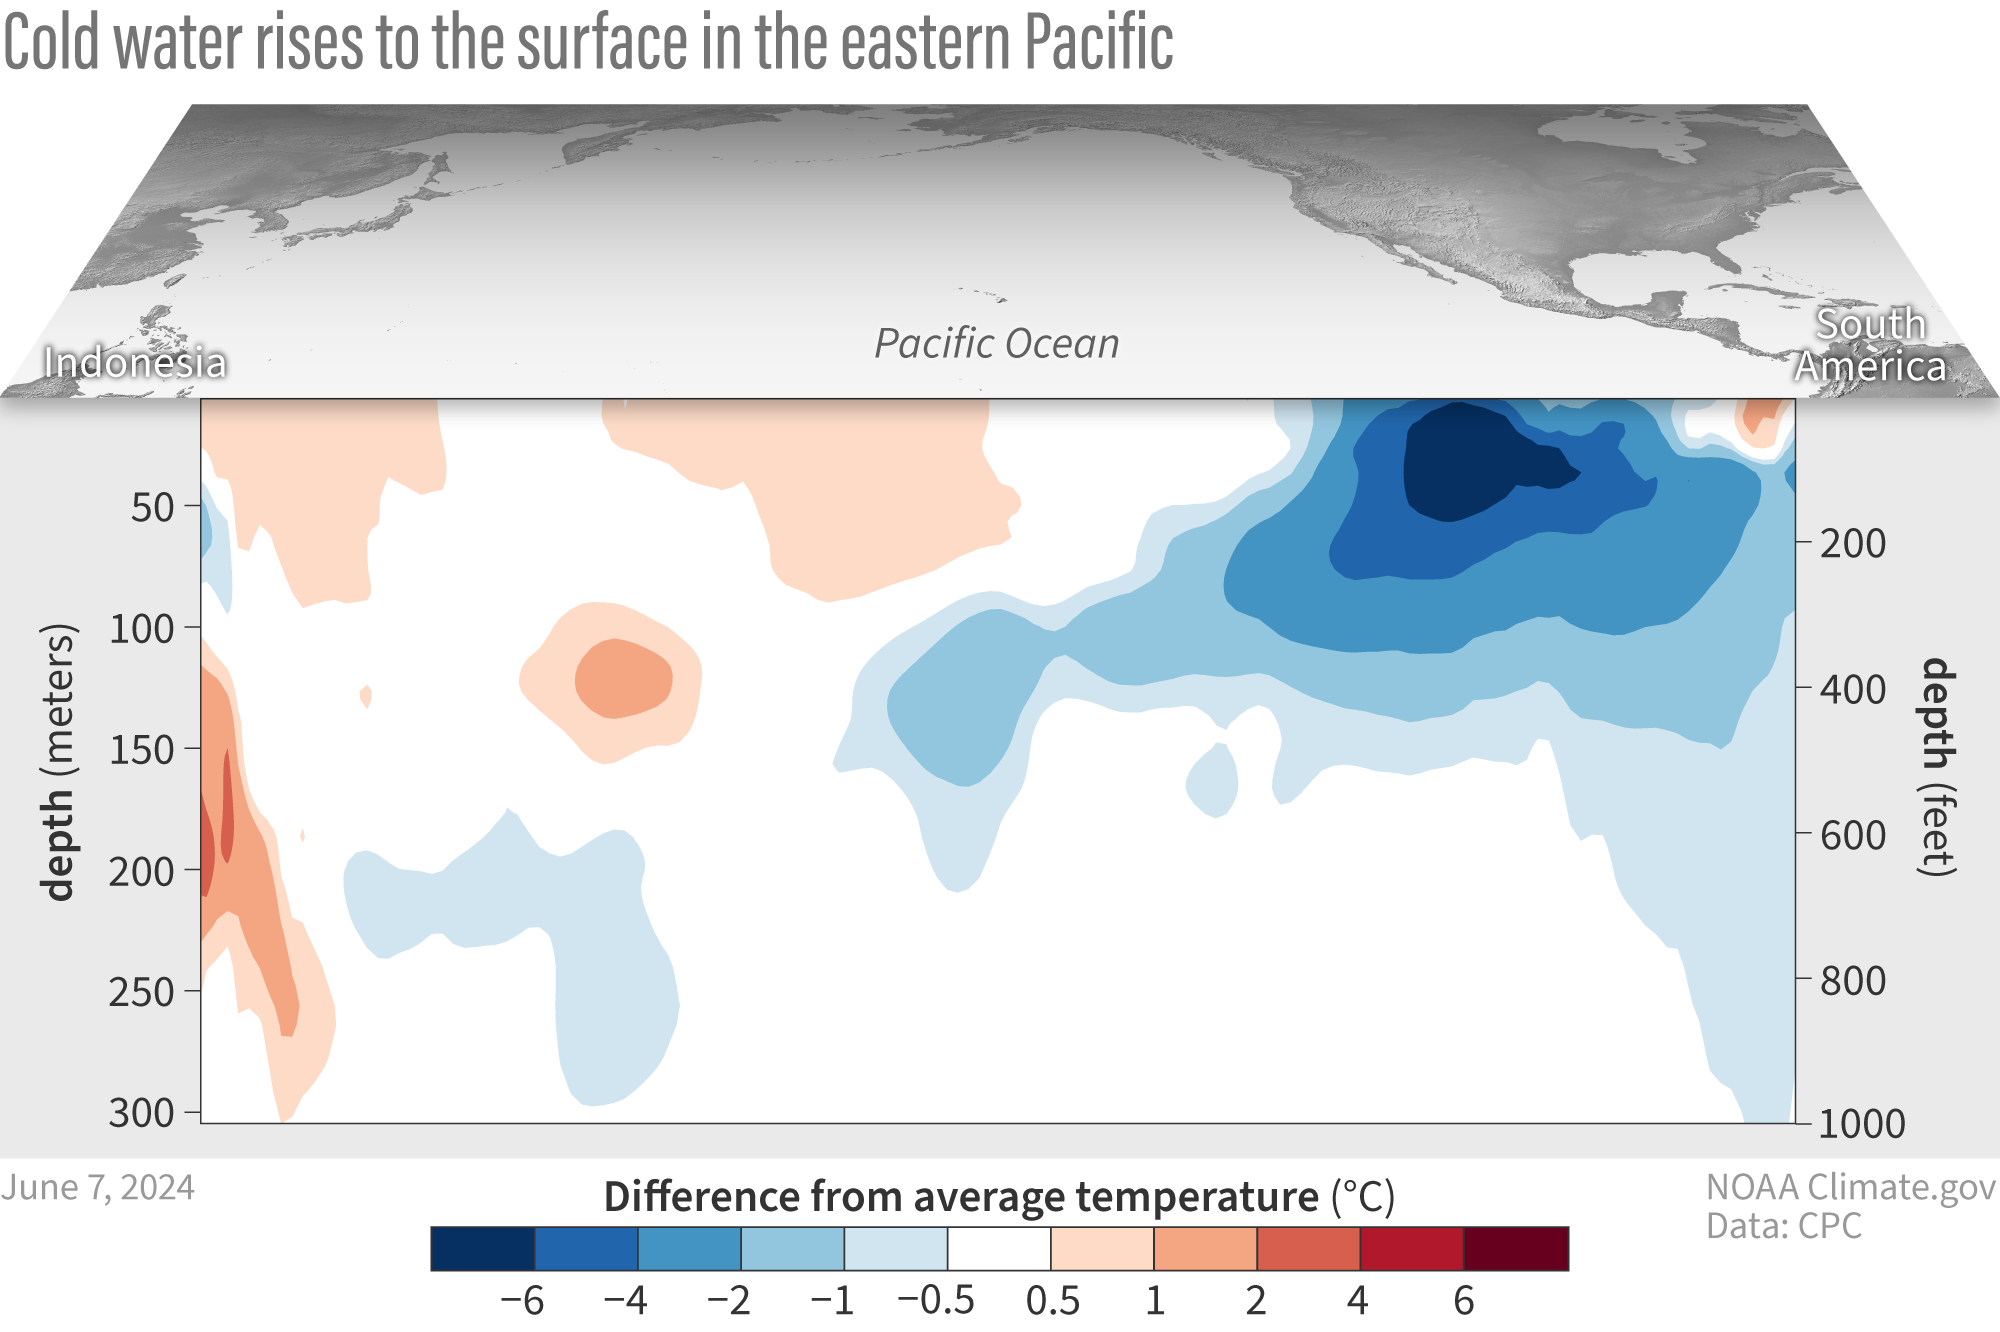
Water temperatures in the top 300 meters (1,000 feet) of the tropical Pacific Ocean compared to the 1991–2020 average in February–April 2024. NOAA Climate.gov animation, based on data from NOAA's Climate Prediction Center.
This website is an ARCHIVED version of NOAA Climate.gov as of June 25, 2025.
Content is not being updated or maintained, and some links may no longer work.
Water temperatures in the top 300 meters (1,000 feet) of the tropical Pacific Ocean compared to the 1991–2020 average in February–April 2024. NOAA Climate.gov animation, based on data from NOAA's Climate Prediction Center.