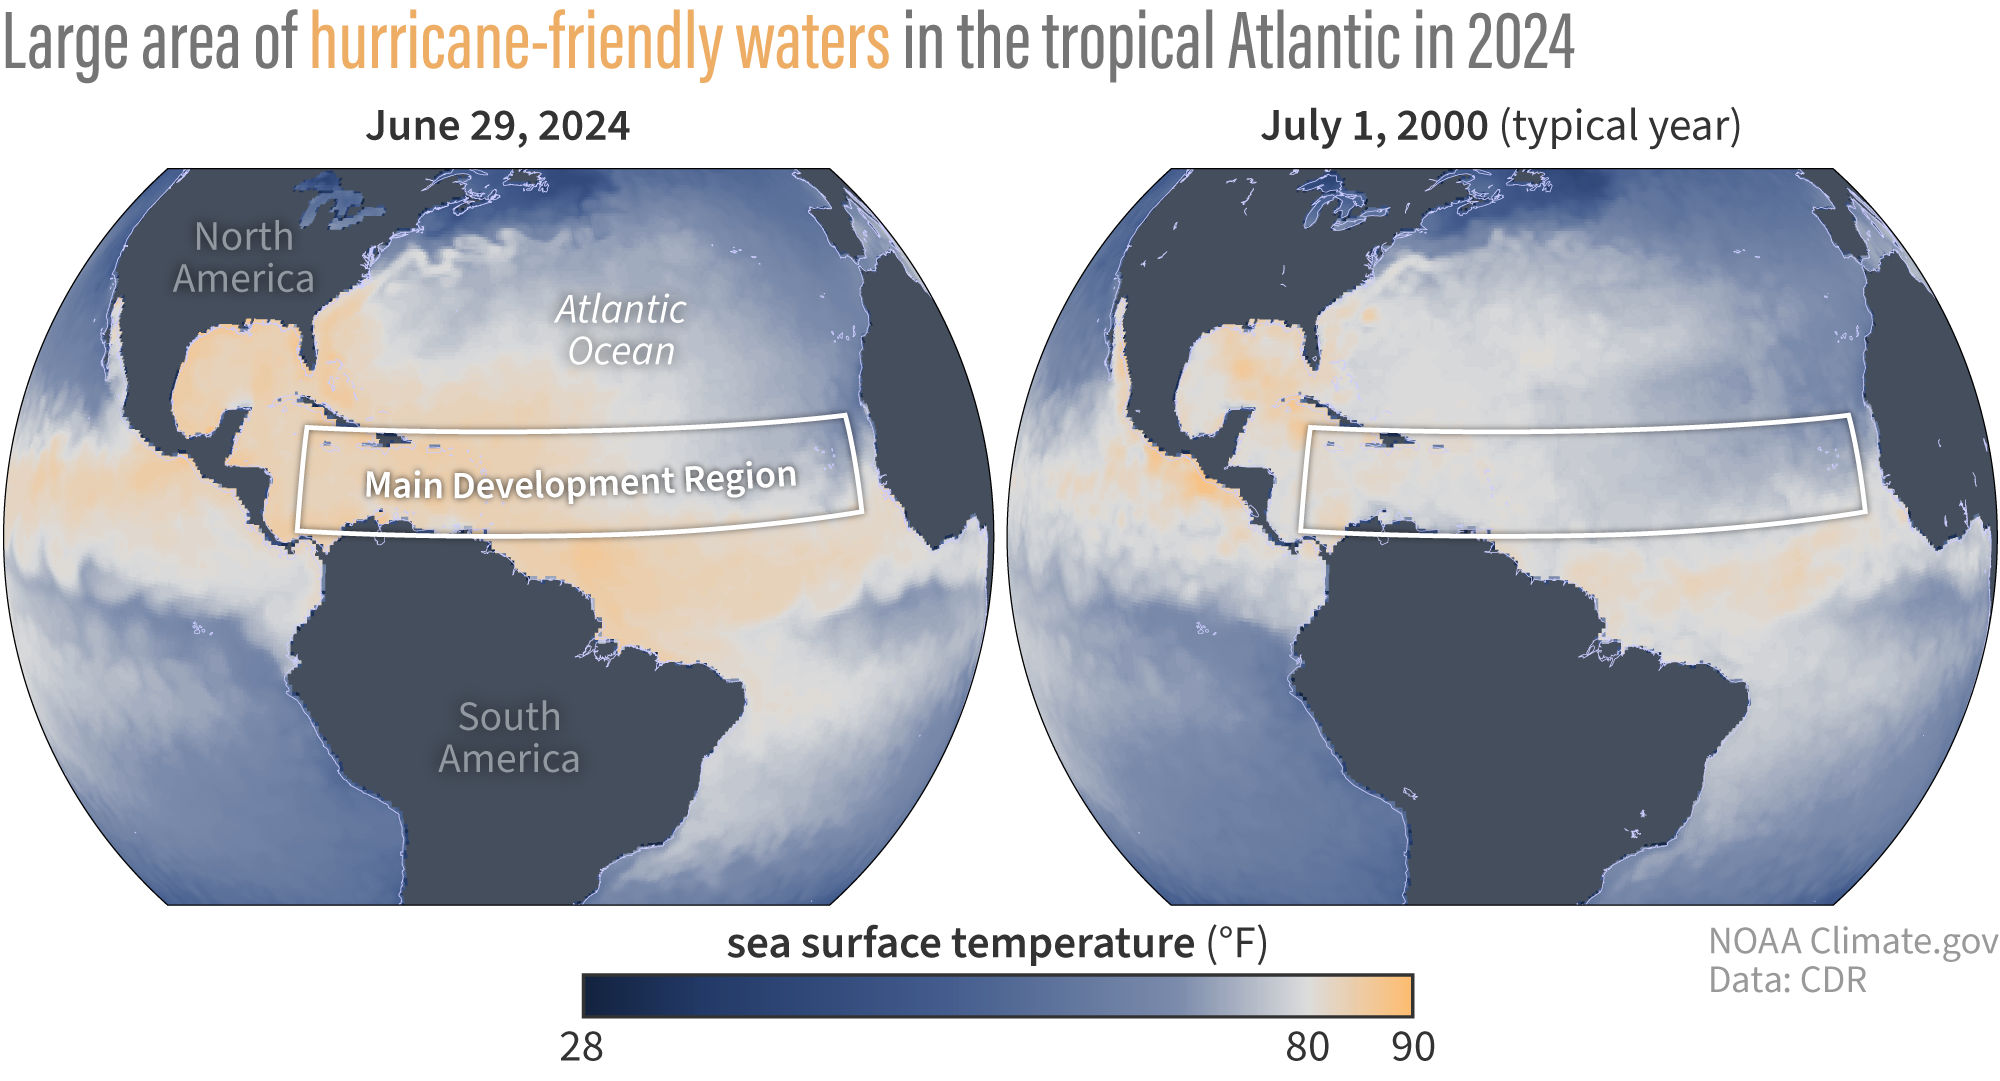
Image caption
Sea surface temperatures in the North Atlantic on June 29, 2024, compared to July 1, 2000. Areas in orange depict temperatures above 80 degrees Fahrenheit—the temperature needed to fuel hurricane development. Temperatures across the main hurricane development region at the end of June 2024 were much warmer and more widespread than on July 1, 2000, in which temperatures were closer to average. Climate.gov images from our Data Snapshots collection, based on OISST data from NCEI.