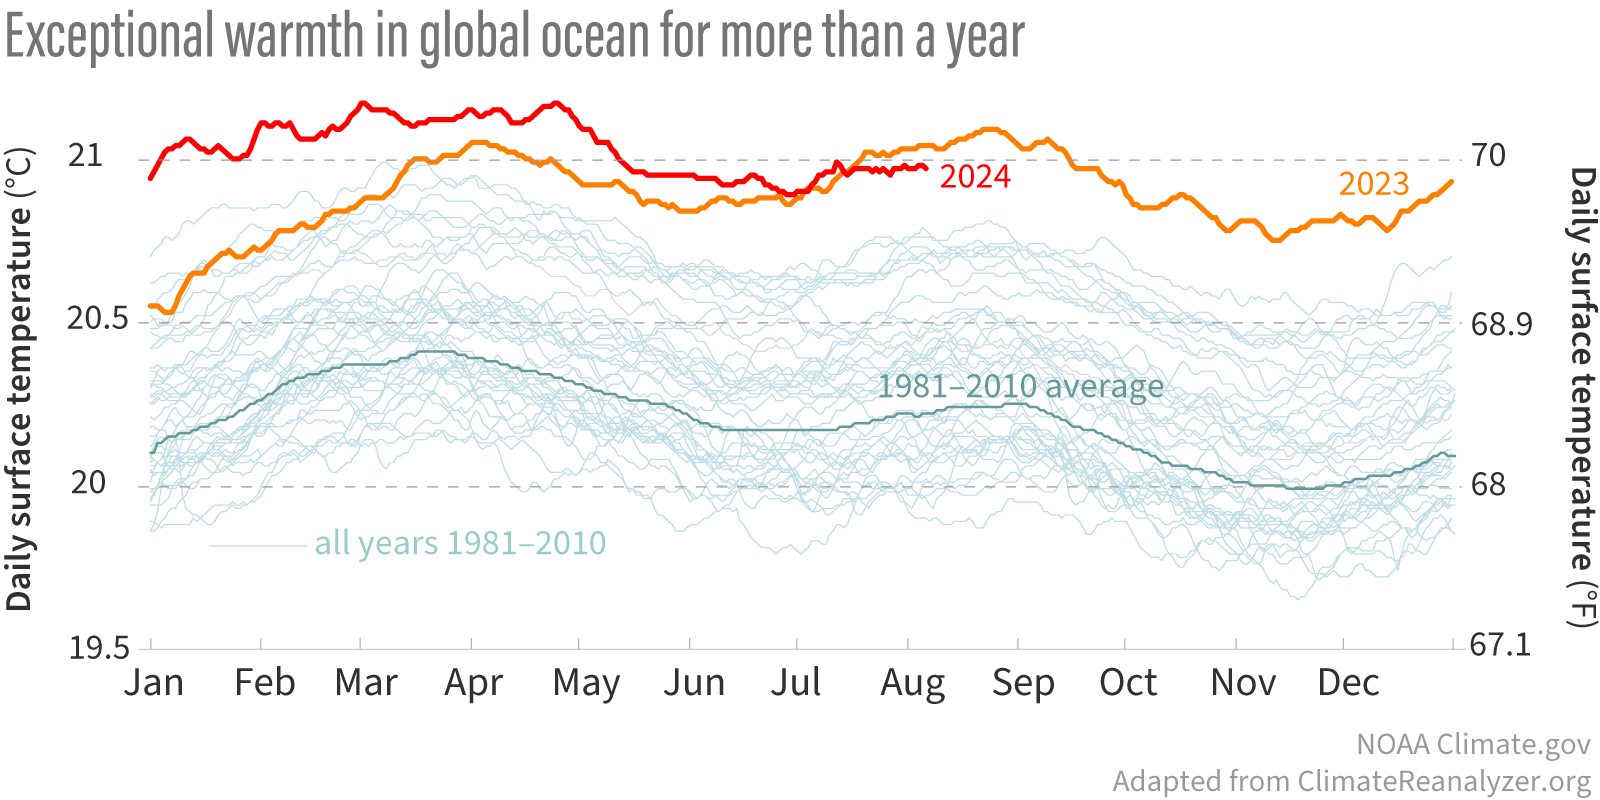
Image caption
Daily surface temperatures for the global oceans between 60˚ North and South from 1981-2024 to date. From April of 2023 (orange line) through May 2024 (red line) temperatures were not only been much warmer than the 1981-2010 average (thick blue-green line), but record warm by a wide margin compared to all other years (thin blue-green lines). NOAA Climate.gov image adapted from Climate Reanalyzer. Explore NOAA's official monthly rankings with the Climate at a Glance tool from the National Centers for Environmental Information.