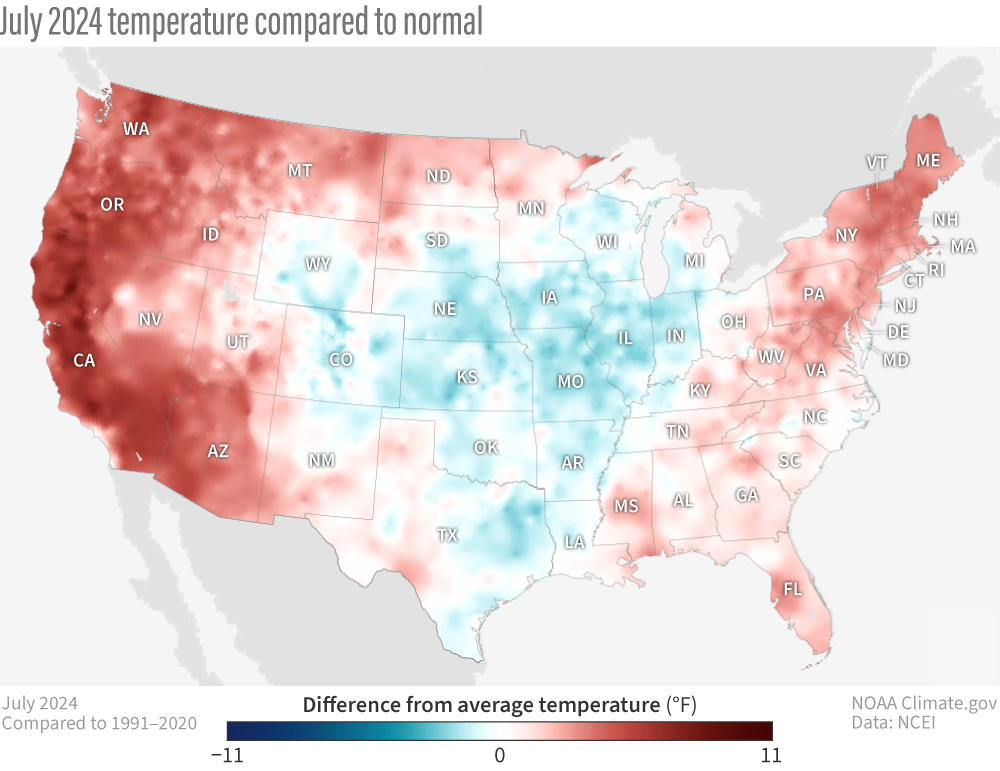
Image caption
Average temperature in July 2024 compared to normal (1991-2020 average). Places that were warmer than average are red; places that were cooler than average are blue. Warmer-than-average temperatures in the West and the East are like a set of parentheses around a pocket of cooler-than-average temperatures in the country's center. NOAA Climate.gov maps from our Data Snapshots: Temperature collection, based on data from NCEI. Visit NCEI for climate statistics for Alaska and Hawaii.